

Question: Hello, what i would like to know is the UCL,CL, and LCL for the P chart, and also if it statistically under control, thanks! 6-1.
Hello, what i would like to know is the UCL,CL, and LCL for the P chart, and also if it statistically under control, thanks! 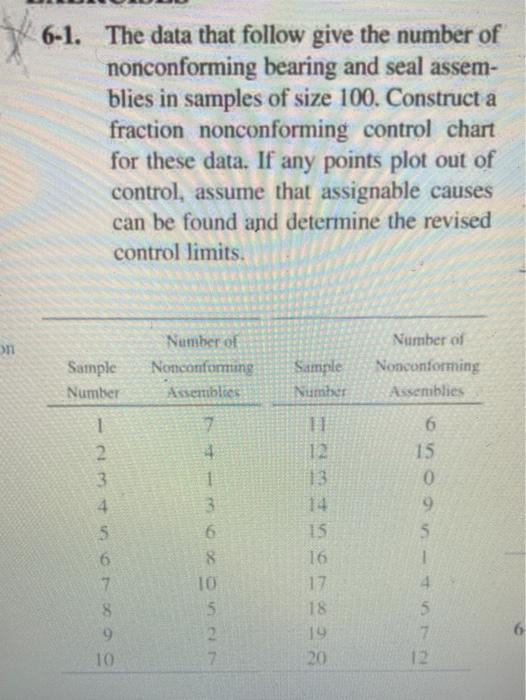
6-1. The data that follow give the number of nonconforming bearing and seal assem- blies in samples of size 100. Construct a fraction nonconforming control chart for these data. If any points plot out of control, assume that assignable causes can be found and determine the revised control limits. on Sample Number Number of Nonconfoming Assemblies Sample Number Number of Nonconforming Assemblies 17 1 2 3 11 12 13 14 13 16 17 1 3 6 8 10 5 2 S 6 7 8 9 10 6 15 0 9 5 1 4 5 7 12 18 6. 19 20
Step by Step Solution
There are 3 Steps involved in it
1 Expert Approved Answer
Step: 1 Unlock

Question Has Been Solved by an Expert!
Get step-by-step solutions from verified subject matter experts
Step: 2 Unlock
Step: 3 Unlock