

Question: Hello, Would someone let me know if I answer correctly, please? (Especially the graph), (3 questions) Thank you. fState the type of correlation between the
Hello,
Would someone let me know if I answer correctly, please? (Especially the graph), (3 questions) Thank you.
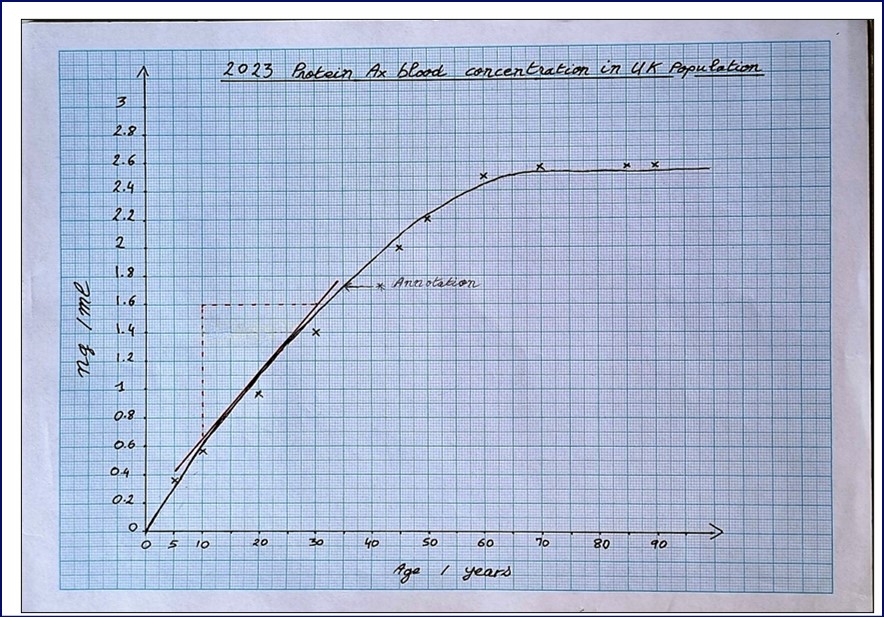
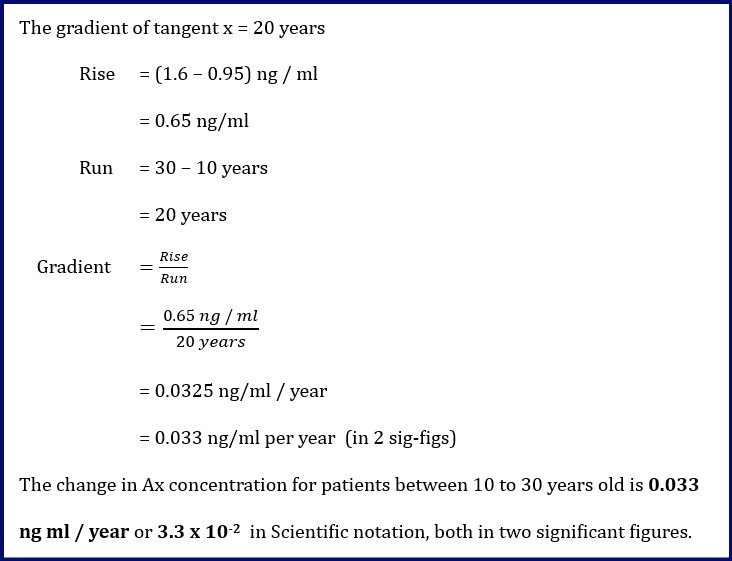
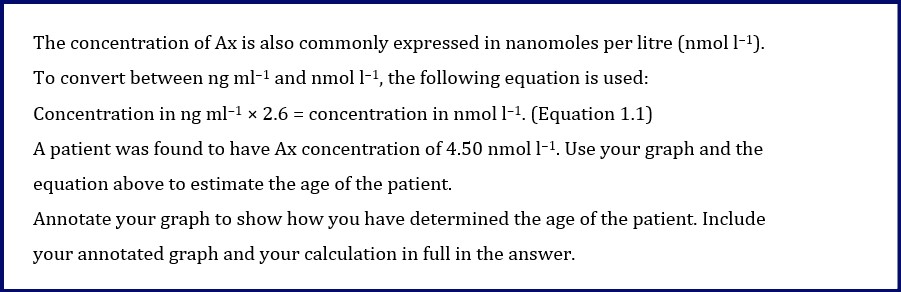
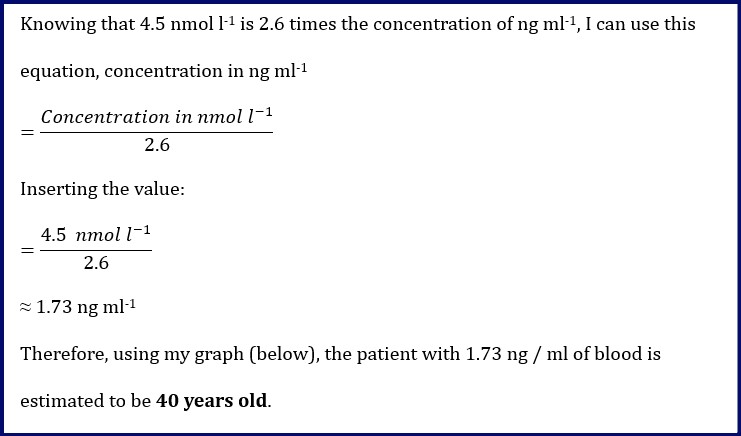
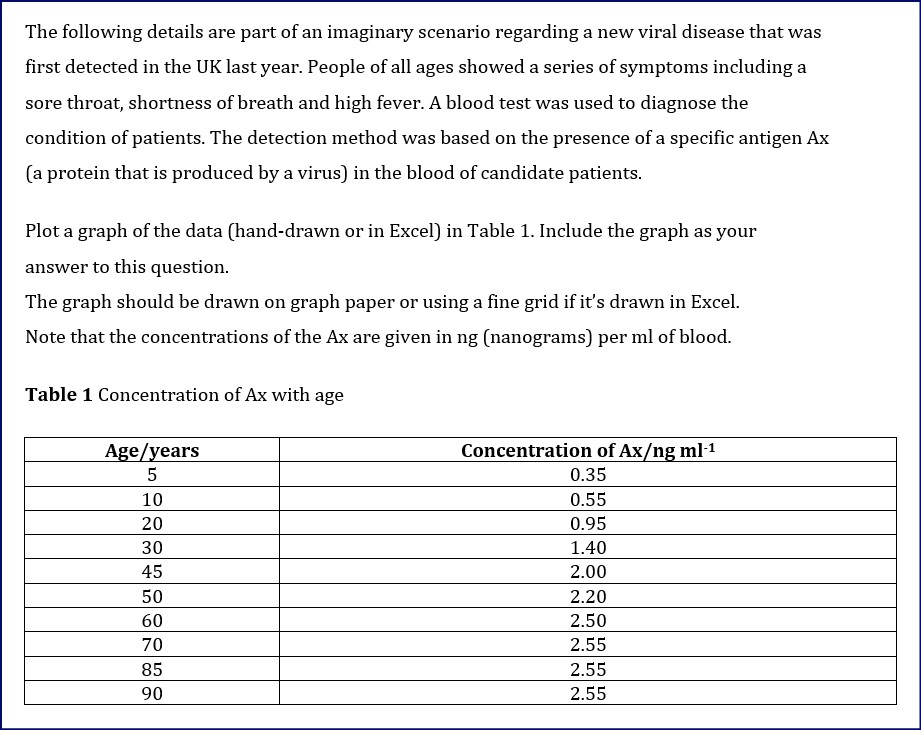
\fState the type of correlation between the concentration of Ax in the blood and the patient's age for: * ages between 0 and 60 years old s ages between 60 and 90 years old. Patients aged 0 to 60 show a concentration of protein Ax that increases with age. However, patients aged 60 to 90 show a high concentration level between 2.5 and 2.55 ng/ml of blood and remain constant. Using Table 1, calculate the rate of change in the concentration of Ax for patients between 10 and 30 years old. The rate of change is given by the gradient of the straight line over this patient age range. Show your calculations in full. The gradient of tangent x = 20 years Rise = (1.6 - 0.95) ng / ml = 0.65 ng/ml Run =30 - 10 years = 20 years Rise Gradient Run 0.65 ng / ml = 20 years = 0.0325 ng/ml / year = 0.033 ng/ml per year (in 2 sig-figs) The change in Ax concentration for patients between 10 to 30 years old is 0.033 ng ml / year or 3.3 x 10⁻² in Scientific notation, both in two significant figures.The concentration of Ax is also commonly expressed in nanomoles per litre (nmol 1-1). To convert between ng ml-1 and nmol 1-1, the following equation is used: Concentration in ng ml-1 x 2.6 = concentration in nmol 1-1. (Equation 1.1) A patient was found to have Ax concentration of 4.50 nmol 1-1. Use your graph and the equation above to estimate the age of the patient. Annotate your graph to show how you have determined the age of the patient. Include your annotated graph and your calculation in full in the answer.Knowing that 4.5 nmol 1 is 2.6 times the concentration of ng ml-1, I can use this equation, concentration in ng ml-1 Concentration in nmoll-1 = 2.6 Inserting the value: 4.5 nmoll-1 = 2.6 ~ 1.73 ng ml-1 Therefore, using my graph (below), the patient with 1.73 ng / ml of blood is estimated to be 40 years old.The following details are part of an imaginary scenario regarding a new viral disease that was first detected in the UK last year. People of all ages showed a series of symptoms including a sore throat, shortness of breath and high fever. A blood test was used to diagnose the condition of patients. The detection method was based on the presence of a specific antigen Ax (a protein that is produced by a virus) in the blood of candidate patients. Plot a graph of the data (hand-drawn or in Excel) in Table 1. Include the graph as your answer to this question. The graph should be drawn on graph paper or using a fine grid if it's drawn in Excel. Note that the concentrations of the Ax are given in ng (nanograms) per ml of blood. Table 1 Concentration of Ax with age Age/years Concentration of Axg ml! 5 0.35 10 0.55 20 0.95 30 1.40 45 2.00 50 2.20 60 2.50 70 2.55 85 255 90 255
Step by Step Solution
There are 3 Steps involved in it

Get step-by-step solutions from verified subject matter experts