

Question: Hello, would you be able to help me with this, please? 1. What percent of the data can be expected to be between 66 and
Hello, would you be able to help me with this, please?
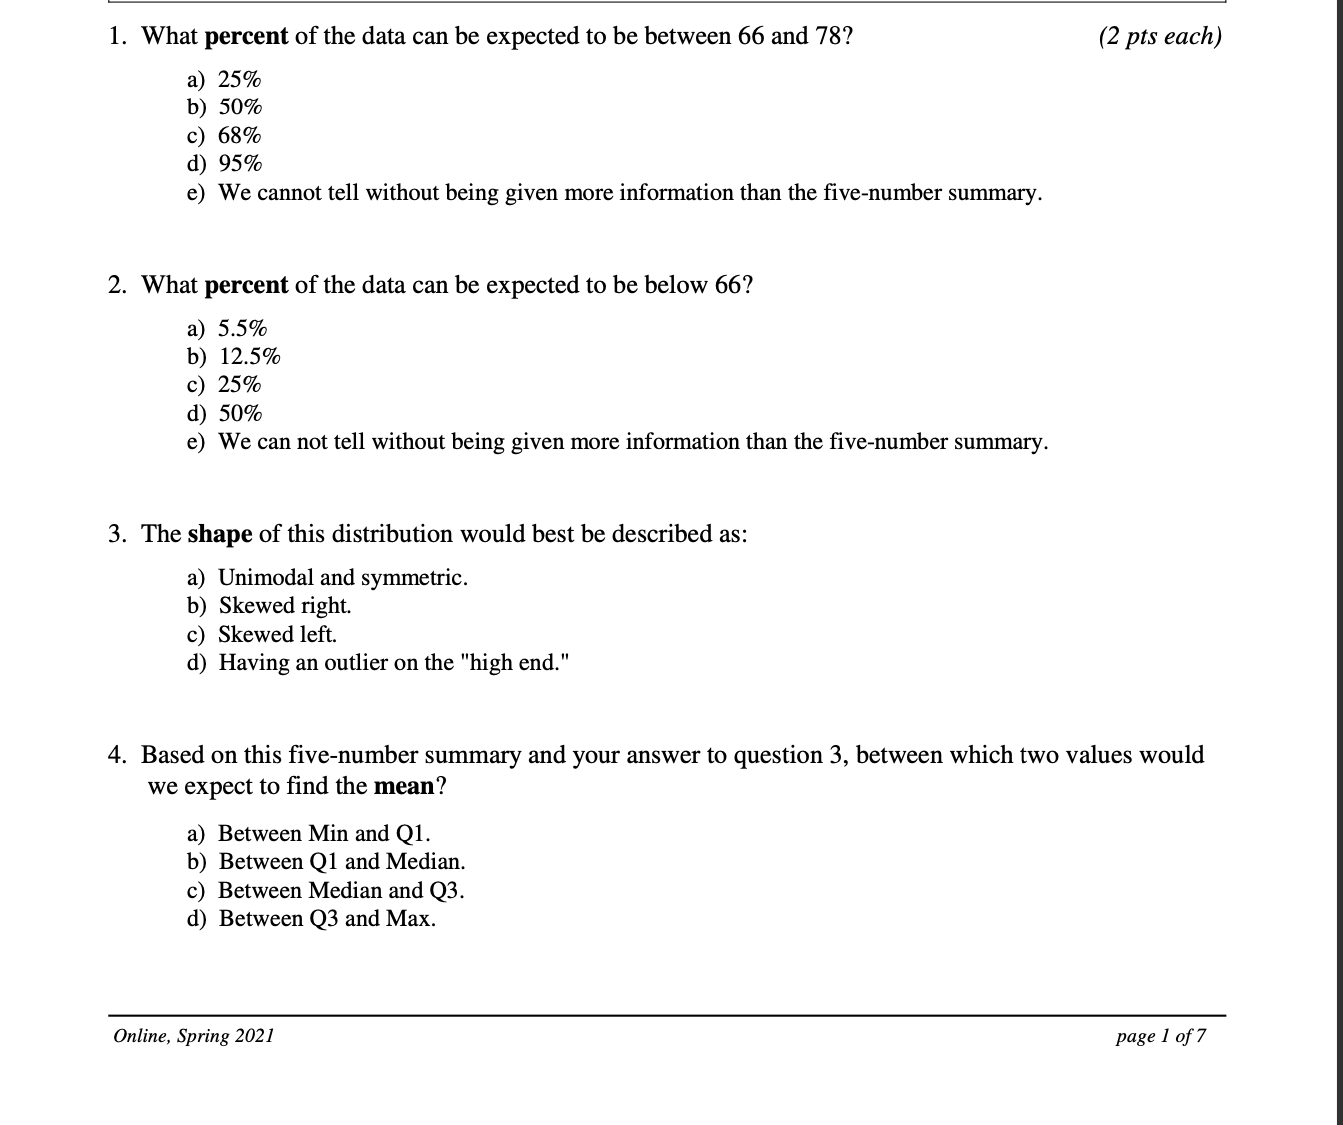
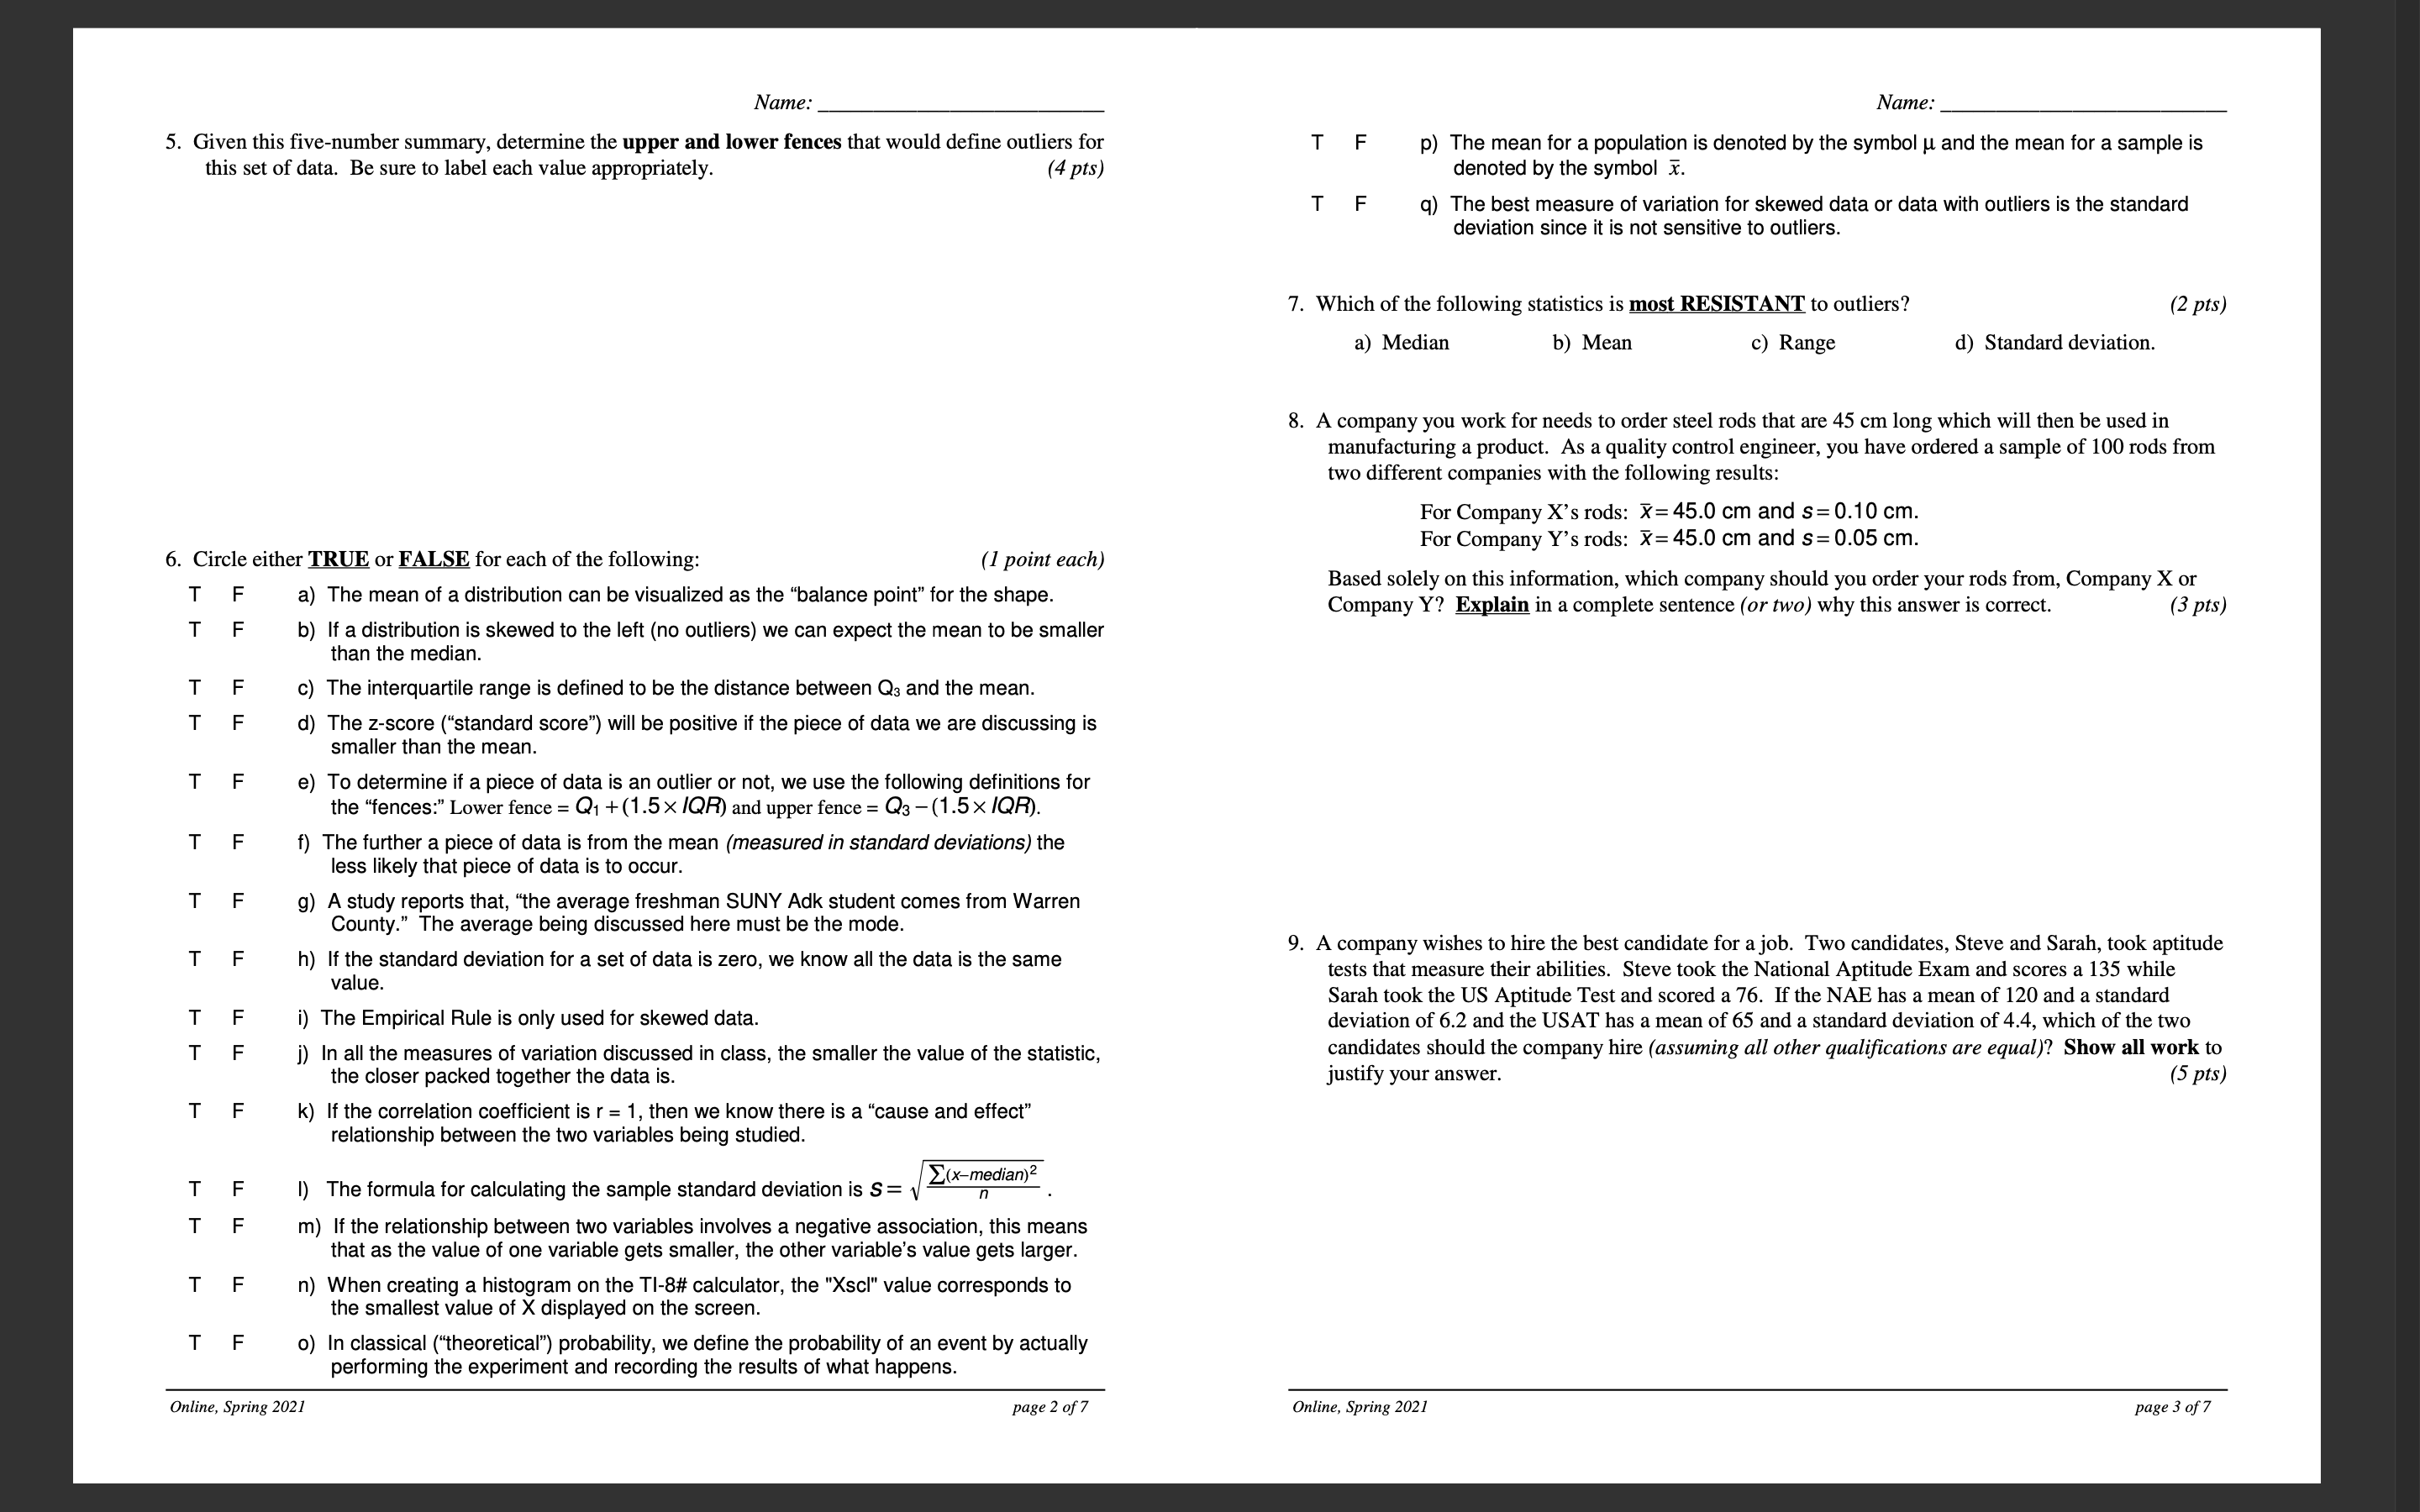
1. What percent of the data can be expected to be between 66 and 78? (2 pts each) a) 25% b) 50% c) 68% d) 95% e) We cannot tell without being given more information than the ve-number summary. 2. What percent of the data can be expected to be below 66? a) 5.5% b) 12.5% c) 25% d) 50% e) We can not tell without being given more information than the ve-number summary. 3. The shape of this distribution would best be described as: a) Unimodal and symmetric. b) Skewed right. c) Skewed left. d) Having an outlier on the "high end." 4. Based on this five-number Summary and yoar answer to question 3, between which two values would we expect to nd the mean? a) Between Min and Q1. b) Between Q1 and Median. c) Between Median and Q3. d) Between Q3 and Max. Unline, Spring 2021' page 1 of 7 Name: 5 Given this ve-number summary, determine the upper and lower fences that would dene outliers for this set of data. Be sure to Label each value appropriately. (4 pts) 6. Circle either TR! E or FALSE for each of the following: (I point each) F a) The mean of a distribution can be visualized as the "balance point" for the shape. F b) If a distribution is skewed to the left (no outliers) we can emect the mean to be smaller than the median. F c) The interquartile range is defined to be the distance between 03 and the mean. d) The zsoore (\"standard score") will be positive if the piece of data we are discussing is smaller than the mean. e) To determine if a piece of data is an outlier or not. we use the following definitions for the \"fences" Lower fence = 0. +(1.5 >
Step by Step Solution
There are 3 Steps involved in it

Get step-by-step solutions from verified subject matter experts