

Question: Hello, Would you please tell me what code I would need to calculate these values in R? I have included pictures of the data set
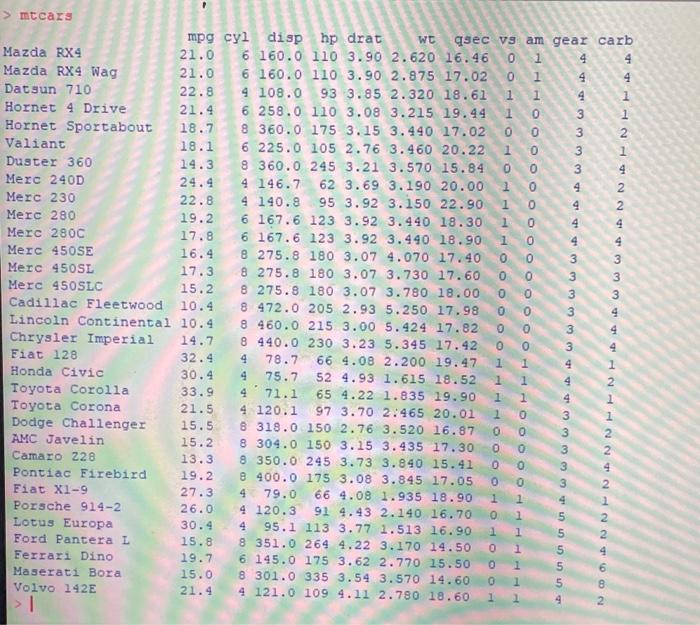
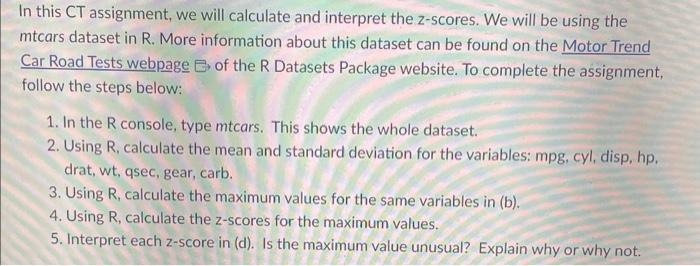
In this CT assignment, we will calculate and interpret the z-scores. We will be using the mtcars dataset in R. More information about this dataset can be found on the Motor Trend Car Road Tests webpage of the R Datasets Package website. To complete the assignment, follow the steps below: 1. In the R console, type mtcars. This shows the whole dataset. 2. Using R, calculate the mean and standard deviation for the variables: mpg, cyl, disp, hp, drat, wt, qsec, gear, carb. 3. Using R, calculate the maximum values for the same variables in (b). 4. Using R, calculate the z-scores for the maximum values. 5. Interpret each z-score in (d). Is the maximum value unusual? Explain why or why not
Step by Step Solution
There are 3 Steps involved in it

Get step-by-step solutions from verified subject matter experts