

Question: help 1) Based on the graph below, fill out the table on the right. Domestic Tofu Market Price $60 Quantity supply Price Quantity Demanded Supplied
help
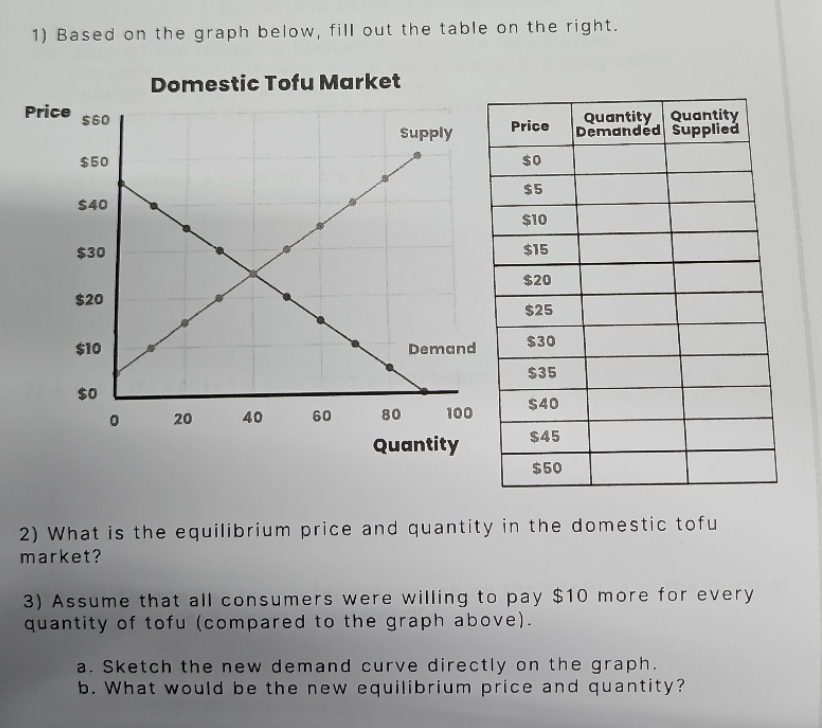
1) Based on the graph below, fill out the table on the right. Domestic Tofu Market Price $60 Quantity supply Price Quantity Demanded Supplied $50 $0 $5 $40 $10 $30 $15 $20 $20 $25 $10 Demand $30 $35 $0 40 60 80 100 $40 20 Quantity $45 $50 2) What is the equilibrium price and quantity in the domestic tofu market? 3) Assume that all consumers were willing to pay $10 more for every quantity of tofu (compared to the graph above). a. Sketch the new demand curve directly on the graph. b. What would be the new equilibrium price and quantity
Step by Step Solution
There are 3 Steps involved in it
1 Expert Approved Answer
Step: 1 Unlock

Question Has Been Solved by an Expert!
Get step-by-step solutions from verified subject matter experts
Step: 2 Unlock
Step: 3 Unlock