

Question: Help:( 1.4 Using Microsoft excel, determine and plot BOD graphs after x days given ultimate BOD of 280 mg/L. Please attach excel sheet with all
Help:(
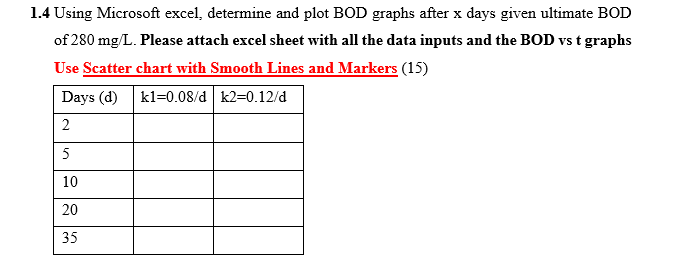
1.4 Using Microsoft excel, determine and plot BOD graphs after x days given ultimate BOD of 280 mg/L. Please attach excel sheet with all the data inputs and the BOD vs t graphs Use Scatter chart with Smooth Lines and Markers (15) Days (d) kl=0.08/dk2=0.12/d 2 5 10 20 8 | 35
Step by Step Solution
There are 3 Steps involved in it
1 Expert Approved Answer
Step: 1 Unlock

Question Has Been Solved by an Expert!
Get step-by-step solutions from verified subject matter experts
Step: 2 Unlock
Step: 3 Unlock