

Question: HELP ALL PARTS ASAP PLEASE!!! Complete ratio analysis, recognizing significant differences Home Health, Inc., has come to Jane Ross for a yearly financial checkup. As
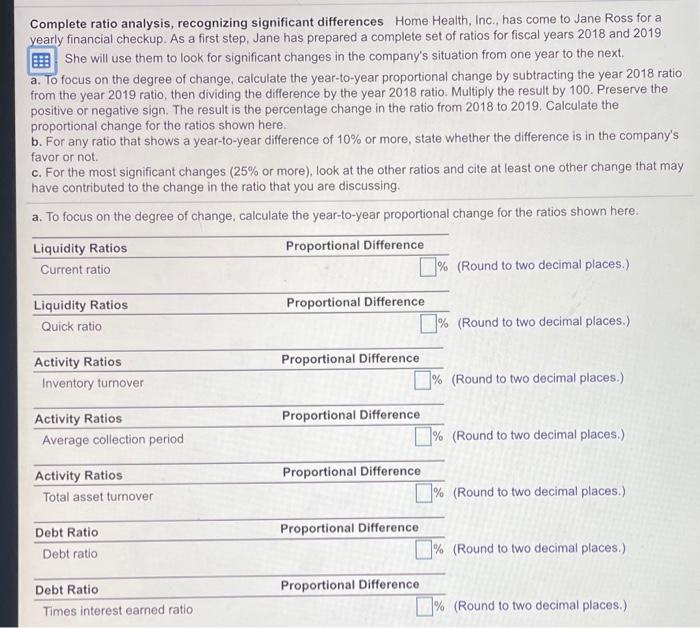
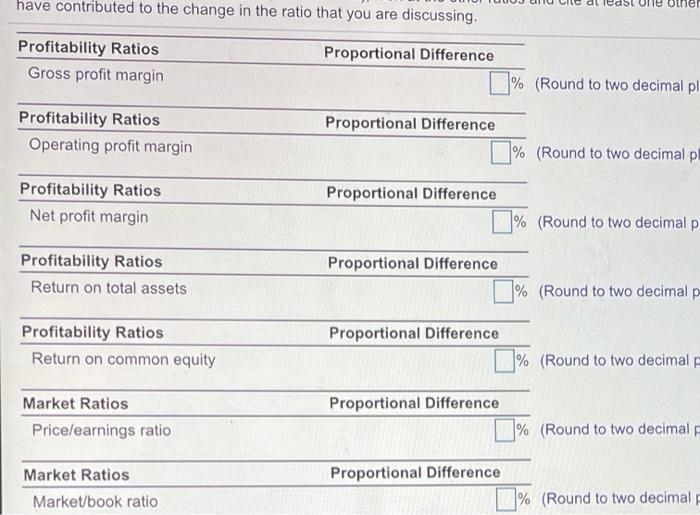
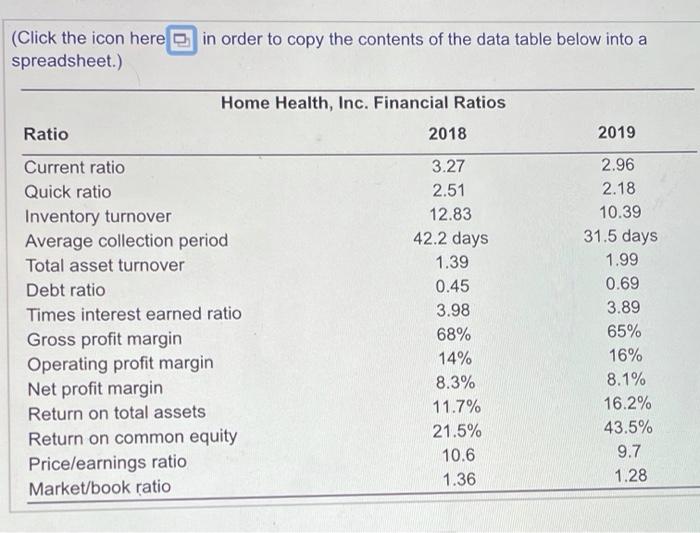
Complete ratio analysis, recognizing significant differences Home Health, Inc., has come to Jane Ross for a yearly financial checkup. As a first step, Jane has prepared a complete set of ratios for fiscal years 2018 and 2019 E She will use them to look for significant changes in the company's situation from one year to the next. a. To focus on the degree of change, calculate the year-to-year proportional change by subtracting the year 2018 ratio from the year 2019 ratio, then dividing the difference by the year 2018 ratio. Multiply the result by 100. Preserve the positive or negative sign. The result is the percentage change in the ratio from 2018 to 2019. Calculate the proportional change for the ratios shown here. b. For any ratio that shows a year-to-year difference of 10% or more, state whether the difference is in the company's favor or not. c. For the most significant changes (25% or more), look at the other ratios and cite at least one other change that may have contributed to the change in the ratio that you are discussing. a. To focus on the degree of change, calculate the year-to-year proportional change for the ratios shown here. Liquidity Ratios Proportional Difference Current ratio % (Round to two decimal places.) Liquidity Ratios Proportional Difference Quick ratio % (Round to two decimal places.) Activity Ratios Inventory turnover Proportional Difference % (Round to two decimal places.) Activity Ratios Average collection period Activity Ratios Total asset turnover Proportional Difference % (Round to two decimal places.) Proportional Difference % (Round to two decimal places.) Proportional Difference % (Round to two decimal places.) Proportional Difference % (Round to two decimal places.) Debt Ratio Debt ratio Debt Ratio Times interest earned ratio have contributed to the change in the ratio that you are discussing. at least one Profitability Ratios Gross profit margin Proportional Difference % (Round to two decimal pl Profitability Ratios Operating profit margin Proportional Difference % (Round to two decimal pl Profitability Ratios Net profit margin Proportional Difference 1% (Round to two decimal p Profitability Ratios Return on total assets Proportional Difference 1% (Round to two decimal p Proportional Difference % (Round to two decimal p Profitability Ratios Return on common equity Market Ratios Price/earnings ratio Proportional Difference % (Round to two decimal Proportional Difference Market Ratios Market/book ratio % (Round to two decimal (Click the icon here in order to copy the contents of the data table below into a spreadsheet.) Home Health, Inc. Financial Ratios Ratio 2018 2019 Current ratio Quick ratio Inventory turnover Average collection period Total asset turnover Debt ratio Times interest earned ratio Gross profit margin Operating profit margin Net profit margin Return on total assets Return on common equity Pricelearnings ratio Market/book ratio 3.27 2.51 12.83 42.2 days 1.39 0.45 3.98 68% 14% 8.3% 11.7% 21.5% 10.6 1.36 2.96 2.18 10.39 31.5 days 1.99 0.69 3.89 65% 16% 8.1% 16.2% 43.5% 9.7 1.28
Step by Step Solution
There are 3 Steps involved in it

Get step-by-step solutions from verified subject matter experts