

Question: Help!! and please send the command window screen along. everything i have to do is on the second picture. Plot the equation y=0.41.8x over the
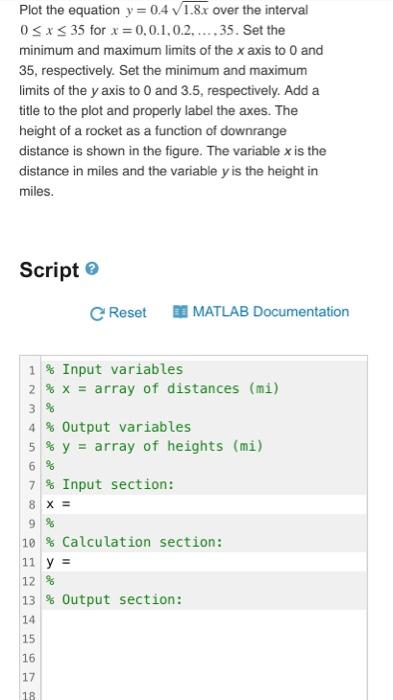
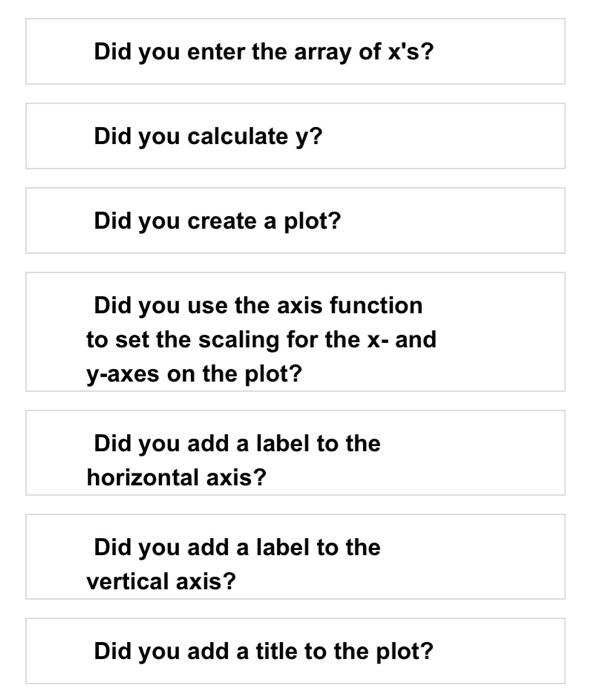
Plot the equation y=0.41.8x over the interval 0x35 for x=0,0.1,0.2,.35. Set the minimum and maximum limits of the x axis to 0 and 35 , respectively. Set the minimum and maximum limits of the y axis to 0 and 3.5 , respectively. Add a title to the plot and properly label the axes. The height of a rocket as a function of downrange distance is shown in the figure. The variable x is the distance in miles and the variable y is the height in miles. Script 3 EB MATLAB Documentation Did you use the axis function to set the scaling for the x - and y-axes on the plot? Did you add a label to the horizontal axis? Did you add a label to the vertical axis? Plot the equation y=0.41.8x over the interval 0x35 for x=0,0.1,0.2,.35. Set the minimum and maximum limits of the x axis to 0 and 35 , respectively. Set the minimum and maximum limits of the y axis to 0 and 3.5 , respectively. Add a title to the plot and properly label the axes. The height of a rocket as a function of downrange distance is shown in the figure. The variable x is the distance in miles and the variable y is the height in miles. Script 3 EB MATLAB Documentation Did you use the axis function to set the scaling for the x - and y-axes on the plot? Did you add a label to the horizontal axis? Did you add a label to the vertical axis
Step by Step Solution
There are 3 Steps involved in it

Get step-by-step solutions from verified subject matter experts