

Question: Help answer question A study was done to determine if the starting salaries of new college graduates can be determined by their G.P.A. and class
Help answer question
![is [ Select ]A large department store has collected the following monthly](https://dsd5zvtm8ll6.cloudfront.net/si.experts.images/questions/2024/10/6708cddd4ffa8_2376708cddd38026.jpg)
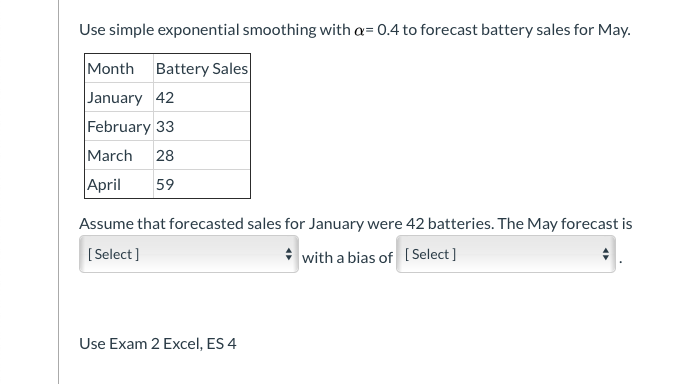
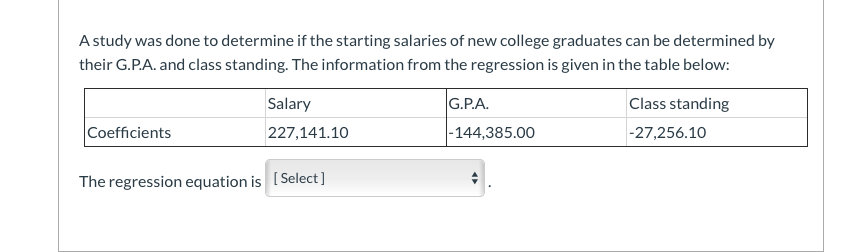
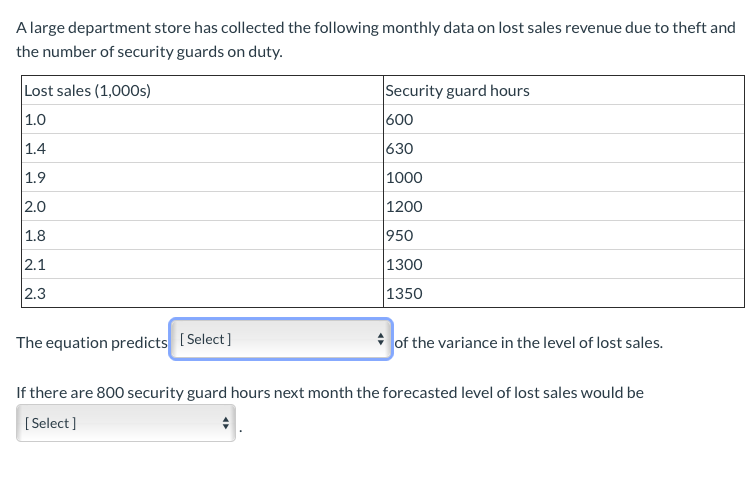
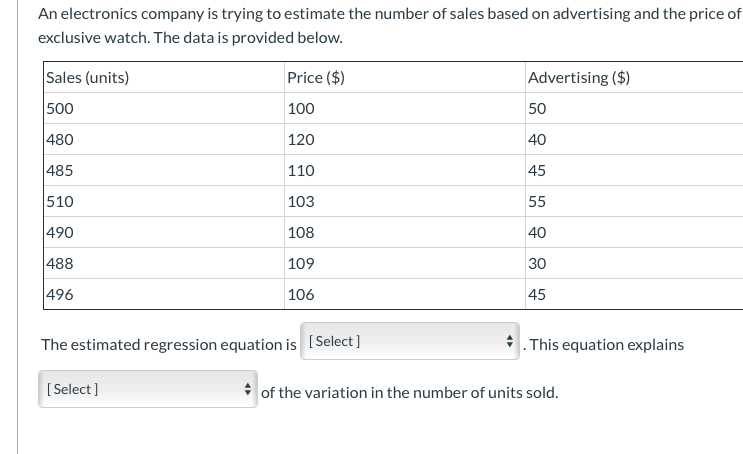
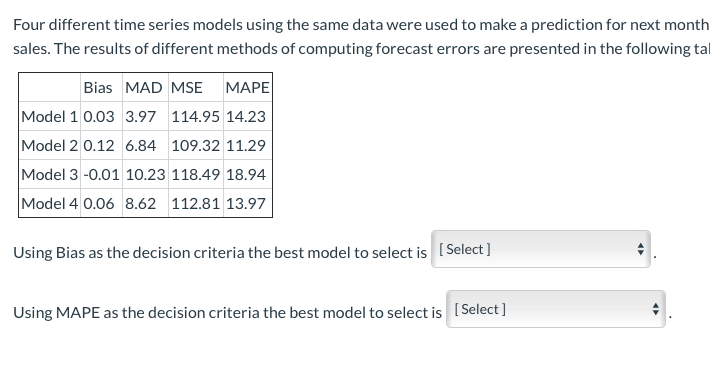
A study was done to determine if the starting salaries of new college graduates can be determined by their G.P.A. and class standing. The information from the regression is given in the table below: Salary G.P.A. Class standing Coefficients 227,141.10 -144,385.00 -27,256.10 The regression equation is [ Select ]A large department store has collected the following monthly data on lost sales revenue due to theft and the number of security guards on duty. Lost sales (1,000s) Security guard hours 1.0 600 1.4 630 1.9 1000 2.0 1200 1.8 950 2.1 1300 2.3 1350 The equation predicts [ Select ] of the variance in the level of lost sales. If there are 800 security guard hours next month the forecasted level of lost sales would be [ Select ]An electronics company is trying to estimate the number of sales based on advertising and the price of exclusive watch. The data is provided below. Sales (units) Price ($) Advertising ($) 500 100 50 480 120 40 485 110 45 510 103 55 490 108 40 488 109 30 496 106 45 The estimated regression equation is [Select ] .This equation explains [ Select ] of the variation in the number of units sold.Four different time series models using the same data were used to make a prediction for next month sales. The results of different methods of computing forecast errors are presented in the following ta| Bias MAD MSE MAPE Model 1 3.03 3.92r 114.95 14.23 Model 2 0. 12 6.34 109.32 11.29 Model 3 4131 13.23 113.49 13.94 Mode|4 0.06 3.62 112.31 13.9?IIr 1F Using Bias as the decision criteria the best model to select is 1 [53'5'11 Using MAPE as the decision criteria the best model to select is 1 [59'3\"] Use the data below. January 20 February 21 March 15 April 14 May 13 June 16 July 17 August 18 September 20 October 20 November 21 December 23 A three month moving average will predict sales of [Select ] for the month of January. With a MAD of [ Select]Use simple exponential smoothing with a= 0.4 to forecast battery sales for May. Month Battery Sales January 42 February 33 March 28 April 59 Assume that forecasted sales for January were 42 batteries. The May forecast is [ Select ] with a bias of [ Select ] Use Exam 2 Excel, ES 4
Step by Step Solution
There are 3 Steps involved in it

Get step-by-step solutions from verified subject matter experts