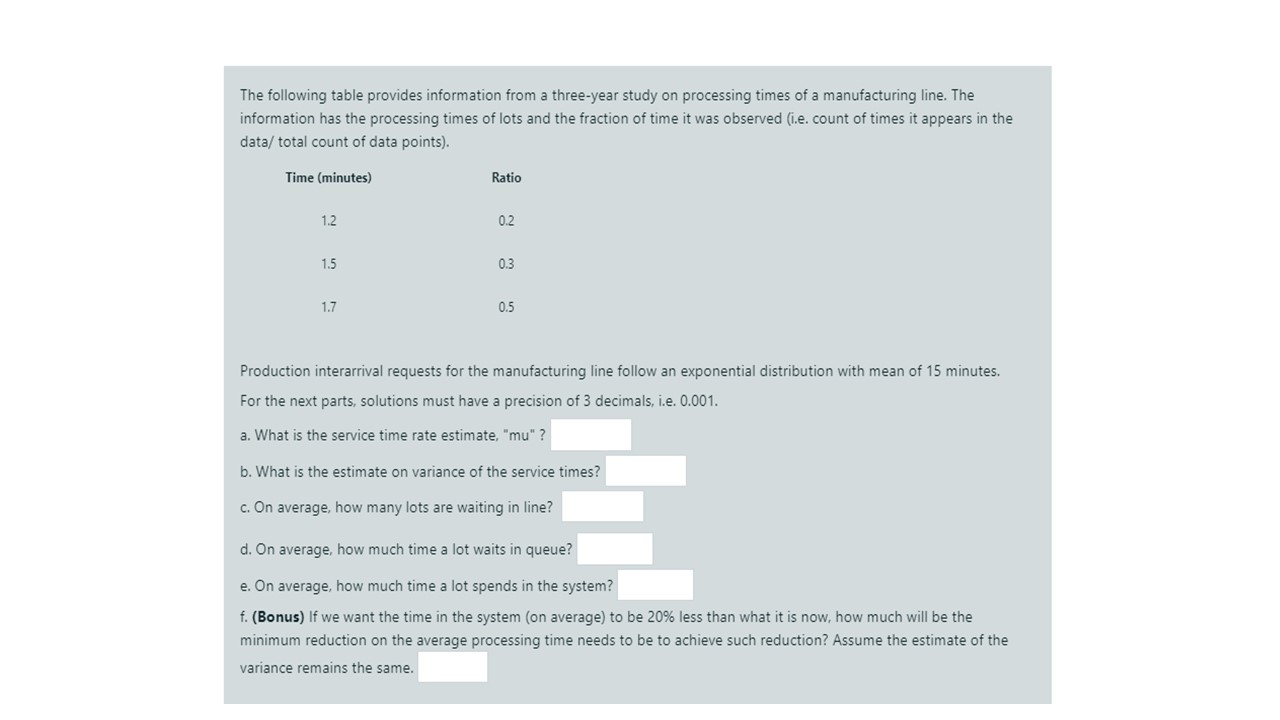
Question: help asap pls The following table provides information from a three-year study on processing times of a manufacturing line. The information has the processing times

help asap pls The following table provideshelp asap pls

The following table provides information from a three-year study on processing times of a manufacturing line. The information has the processing times of lots and the fraction of time it was observed (i.e. count of times it appears in the data/ total count of data points). Time (minutes) Ratio 1.2 0.2 1.5 0.3 1.7 0.5 Production interarrival requests for the manufacturing line follow an exponential distribution with mean of 15 minutes. For the next parts, solutions must have a precision of 3 decimals, i.e. 0.001. a. What is the service time rate estimate, "mu"? b. What is the estimate on variance of the service times? c. On average, how many lots are waiting in line? d. On average, how much time a lot waits in queue? e. On average, how much time a lot spends in the system? f. (Bonus) If we want the time in the system (on average) to be 20% less than what it is now, how much will be the minimum reduction on the average processing time needs to be to achieve such reduction? Assume the estimate of the variance remains the same

Step by Step Solution

There are 3 Steps involved in it

1 Expert Approved Answer
Step: 1 Unlock blur-text-image
Question Has Been Solved by an Expert!

Get step-by-step solutions from verified subject matter experts

Step: 2 Unlock
Step: 3 Unlock

Students Have Also Explored These Related General Management Questions!