

Question: HELP ASAP PLZ Empirical Rule: Examples Based on the Empirical Rule, answer the following questions. 1. What is the probability that data is between one
HELP ASAP PLZ
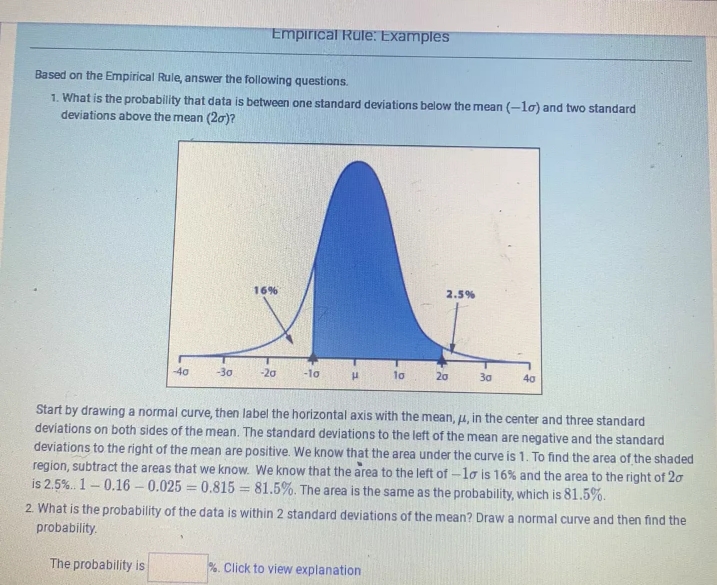
Empirical Rule: Examples Based on the Empirical Rule, answer the following questions. 1. What is the probability that data is between one standard deviations below the mean (-lo) and two standard deviations above the mean (20)? 2.5% 40 -30 -20 -10 H 10 20 30 40 Start by drawing a normal curve, then label the horizontal axis with the mean, /, in the center and three standard deviations on both sides of the mean. The standard deviations to the left of the mean are negative and the standard deviations to the right of the mean are positive. We know that the area under the curve is 1. To find the area of the shaded region, subtract the areas that we know. We know that the area to the left of - 10 is 16% and the area to the right of 20 is 2.5%. 1 - 0.16 - 0.025 = 0.815 = 81.5%. The area is the same as the probability, which is 81.5%. 2. What is the probability of the data is within 2 standard deviations of the mean? Draw a normal curve and then find the probability. The probability is . Click to view explanation
Step by Step Solution
There are 3 Steps involved in it

Get step-by-step solutions from verified subject matter experts