

Question: HELP ASAP - Thermodynamics + Excel This problem requires the use of data from Tables A2E,3E,4E, and 5E for water. 1. Make two figures in
HELP ASAP - Thermodynamics + Excel 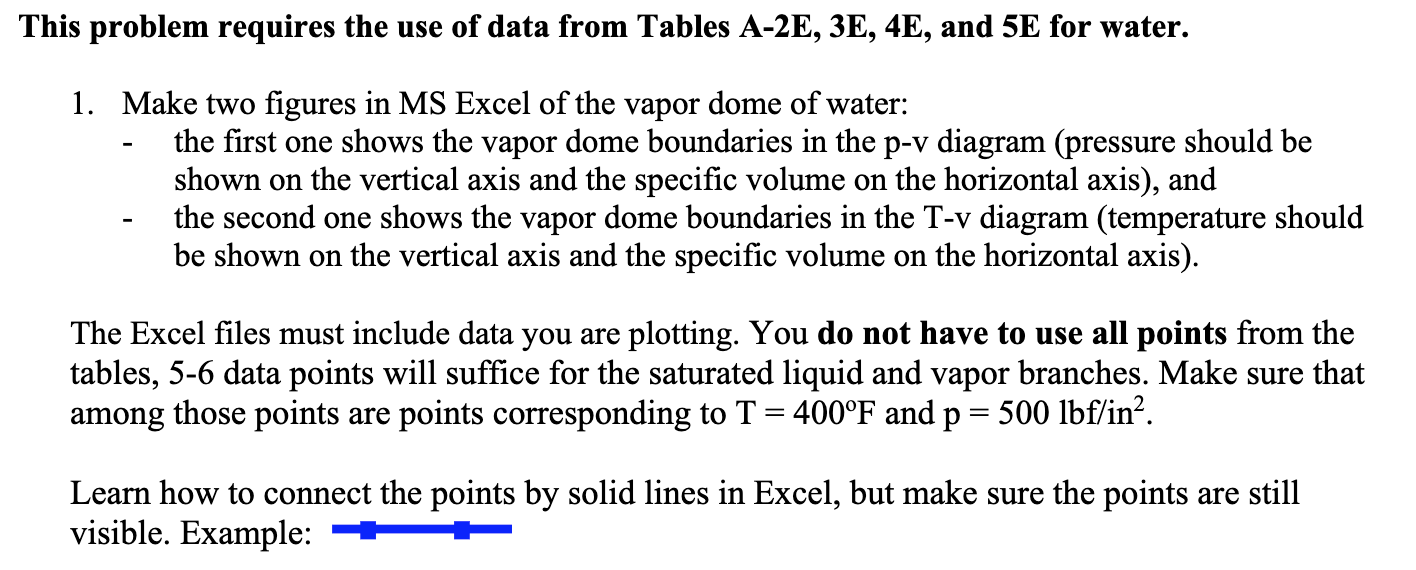
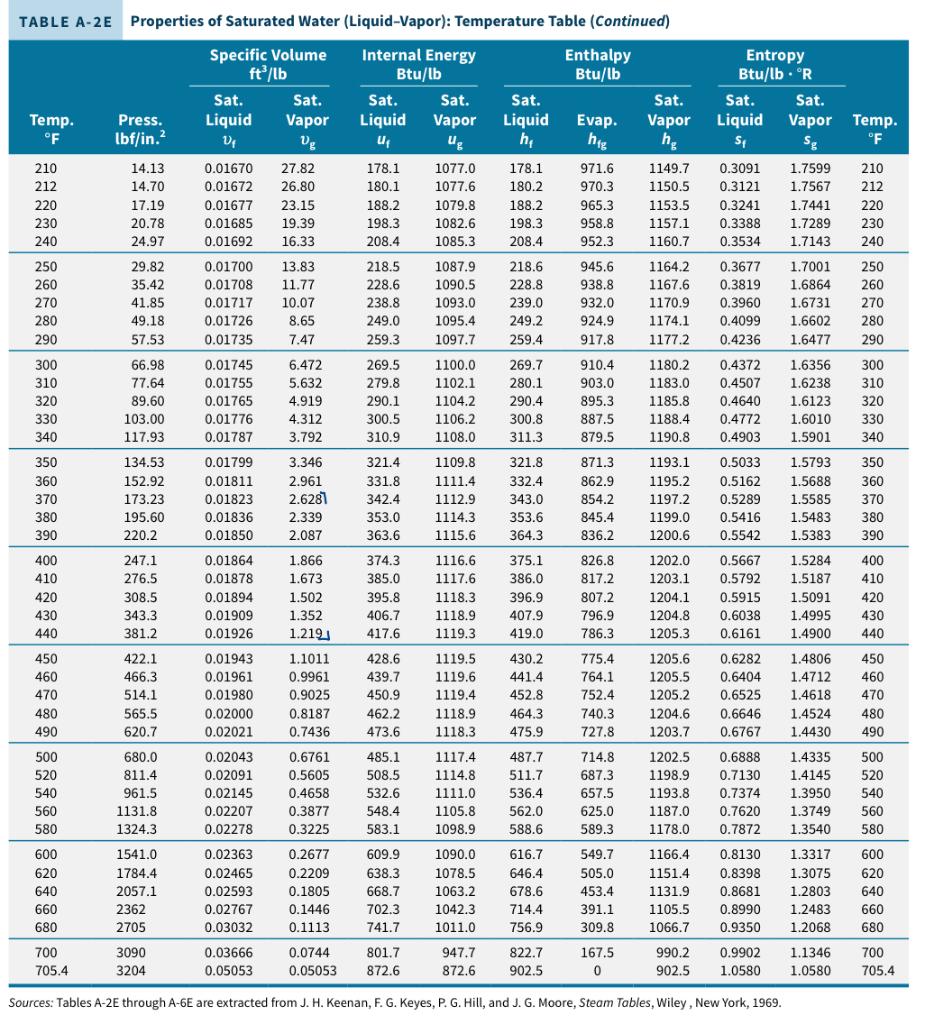
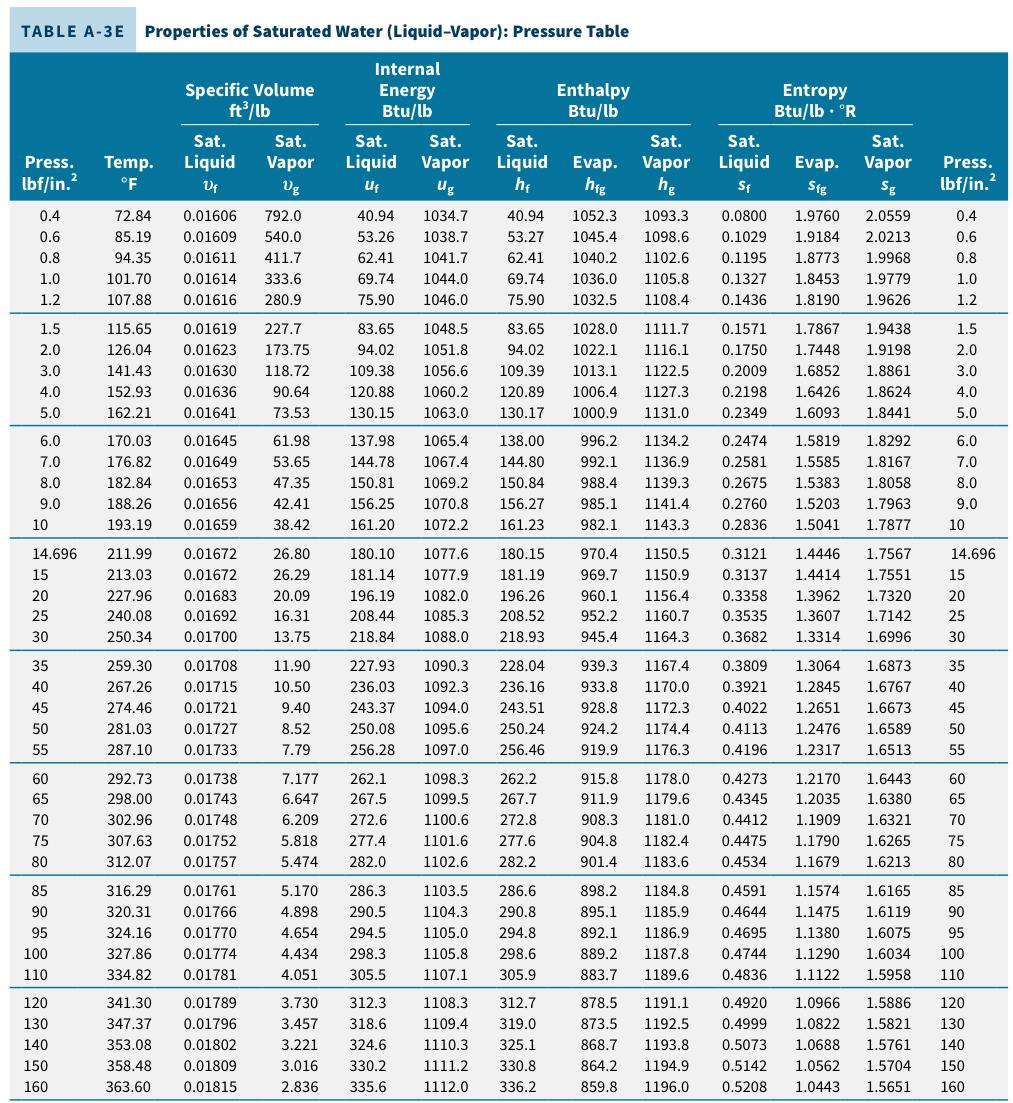
This problem requires the use of data from Tables A2E,3E,4E, and 5E for water. 1. Make two figures in MS Excel of the vapor dome of water: - the first one shows the vapor dome boundaries in the p-v diagram (pressure should be shown on the vertical axis and the specific volume on the horizontal axis), and - the second one shows the vapor dome boundaries in the T-v diagram (temperature should be shown on the vertical axis and the specific volume on the horizontal axis). The Excel files must include data you are plotting. You do not have to use all points from the tables, 5-6 data points will suffice for the saturated liquid and vapor branches. Make sure that among those points are points corresponding to T=400F and p=500lbf/in2. Learn how to connect the points by solid lines in Excel, but make sure the points are still visible. Example: TAB LE A-2 E Properties of Saturated Water (Liquid-Vapor): Temperature Table (Continued) Sources: Tables A-2E through A-6E are extracted from J. H. Keenan, F. G. Keyes, P. G. Hill, and J. G. Moore, Steam Tables, Wiley, New York, 1969. TABLE A-3 E Properties of Saturated Water (Liquid-Vapor): Pressure Table
Step by Step Solution
There are 3 Steps involved in it

Get step-by-step solutions from verified subject matter experts