

Question: Help attached Suppose a government attempts to compare two potential remedies to reduce fishing effort. The figure below shows the total benefit curve (TB) and
Help attached
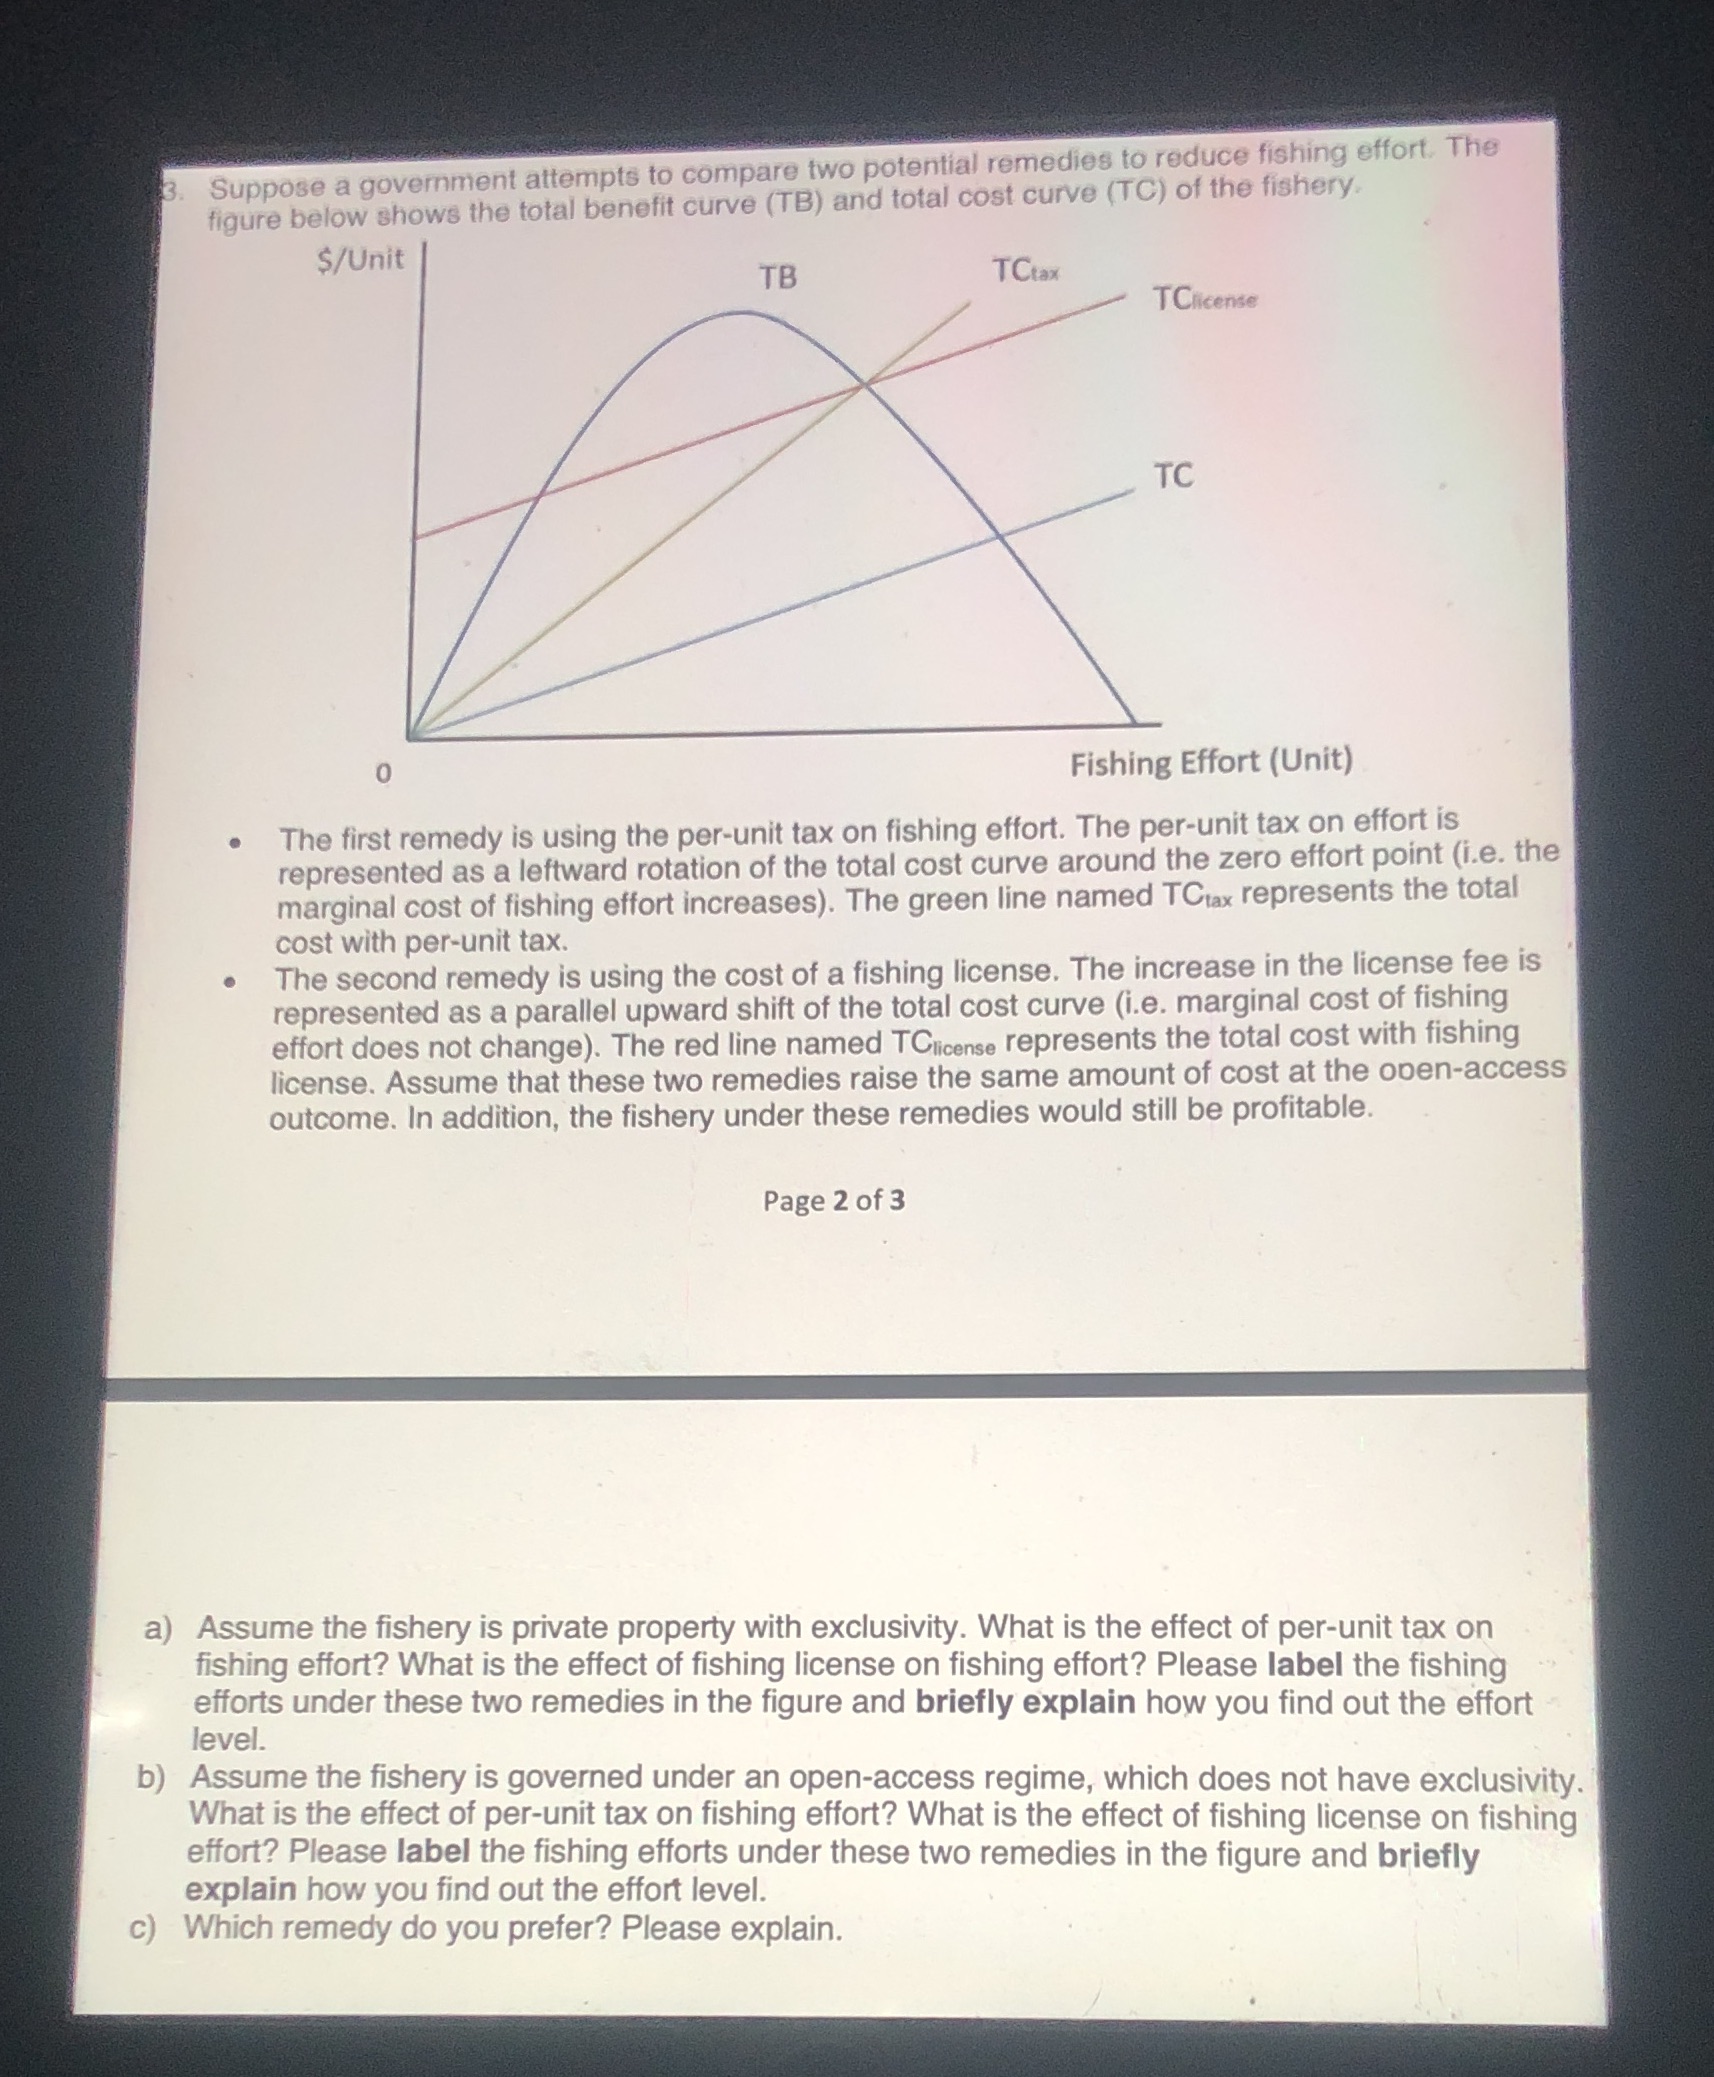
Suppose a government attempts to compare two potential remedies to reduce fishing effort. The figure below shows the total benefit curve (TB) and total cost curve (TC) of the fishery. $/Unit TB TCtax TClicense TC Fishing Effort (Unit) The first remedy is using the per-unit tax on fishing effort. The per-unit tax on effort is represented as a leftward rotation of the total cost curve around the zero effort point (i.e. the marginal cost of fishing effort increases). The green line named TCtax represents the total cost with per-unit tax. The second remedy is using the cost of a fishing license. The increase in the license fee is represented as a parallel upward shift of the total cost curve (i.e. marginal cost of fishing effort does not change). The red line named TClicense represents the total cost with fishing license. Assume that these two remedies raise the same amount of cost at the oven-access outcome. In addition, the fishery under these remedies would still be profitable. Page 2 of 3 a) Assume the fishery is private property with exclusivity. What is the effect of per-unit tax on fishing effort? What is the effect of fishing license on fishing effort? Please label the fishing efforts under these two remedies in the figure and briefly explain how you find out the effort level. b) Assume the fishery is governed under an open-access regime, which does not have exclusivity. What is the effect of per-unit tax on fishing effort? What is the effect of fishing license on fishing effort? Please label the fishing efforts under these two remedies in the figure and briefly explain how you find out the effort level. c) Which remedy do you prefer? Please explain
Step by Step Solution
There are 3 Steps involved in it

Get step-by-step solutions from verified subject matter experts