

Question: help? based off procter and gamble help I. Ratios for credit decision: current ratio, acid-test (quick) ratio, accounts receivable turnover, inventory turnover, days' sales uncollected*,
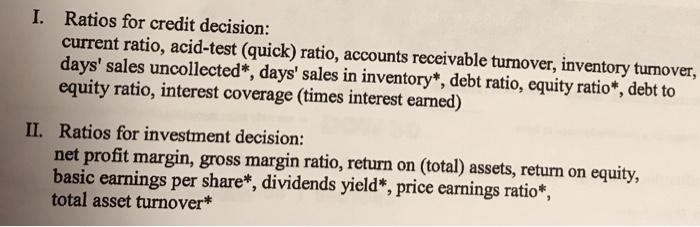
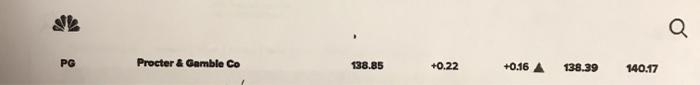
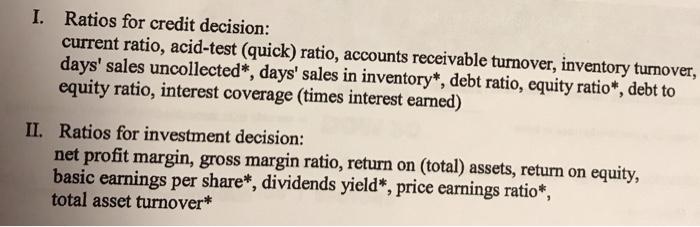
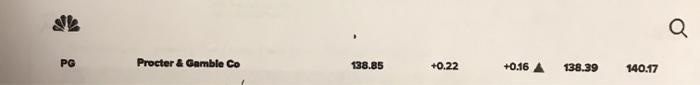
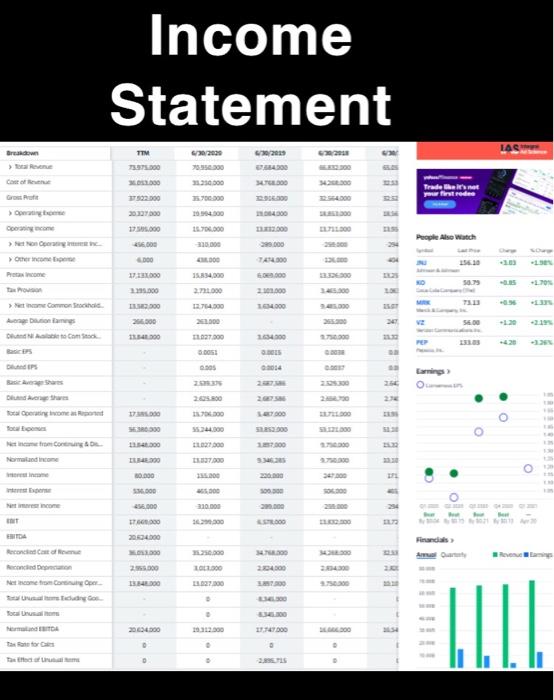
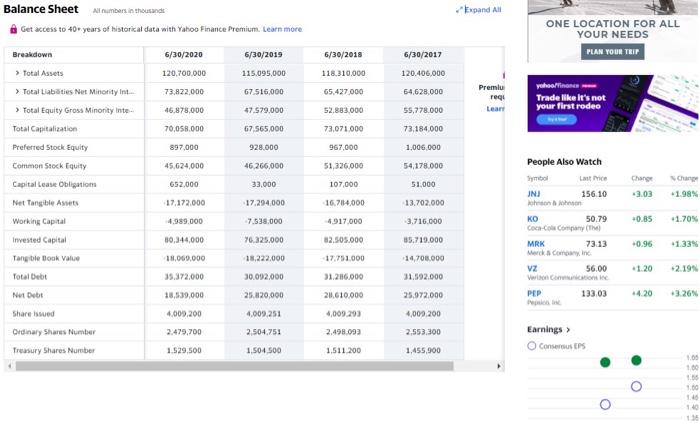
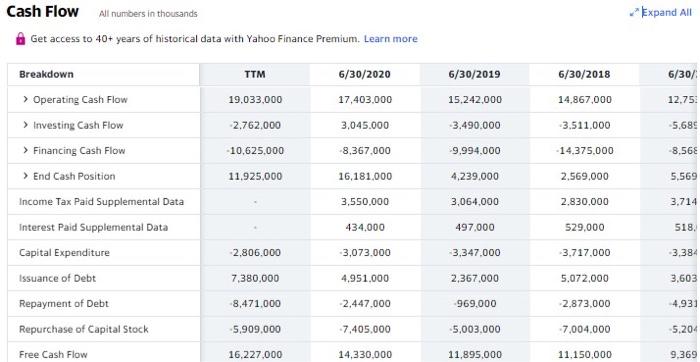
I. Ratios for credit decision: current ratio, acid-test (quick) ratio, accounts receivable turnover, inventory turnover, days' sales uncollected*, days' sales in inventory*, debt ratio, equity ratio*, debt to equity ratio, interest coverage (times interest earned) II. Ratios for investment decision: net profit margin, gross margin ratio, return on (total) assets, return on equity, basic earnings per share*, dividends yield*, price earnings ratio*, total asset turnover* Dow 30 Chart SYMBOL NAME PRICE CHANGE XCHANGE : LOW HIGH PR Q PG Procter & Gamble Co 138.85 +0.22 +0.16 138.39 140.17 I. Ratios for credit decision: current ratio, acid-test (quick) ratio, accounts receivable turnover, inventory turnover, days' sales uncollected*, days' sales in inventory*, debt ratio, equity ratio*, debt to equity ratio, interest coverage (times interest earned) II. Ratios for investment decision: net profit margin, gross margin ratio, return on (total) assets, return on equity, basic earnings per share*, dividends yield*, price earnings ratio*, total asset turnover* Dow 30 Chart SYMBOL NAME PRICE CHANGE XCHANGE LOW HIGH PR PG Procter & Gamble Co 138.85 +0.22 +0.16 138.39 140.17 Income Statement Brown TTM 70.000 630/2020 7:55:00 1.200.000 20/2015 34300 TE000 Case of 1.000 17902.000 fratrodo 1.000 10.000 People Also Watch 256.000 000 000 TAL 5.834,00 1.70 3.000 000 271.000 754.000 104000 > Common Scho Dags No Como 24 14.000 27.000 750.00 1.634.000 GOS 0.005 17.00 encontro con 0.500 300 310.000 255.000 7.000 Recorded the 2.000 25.000 20.000 LOL.300 4.000 204300 2:00 2.400 2 Netcome from MA asso 11147 000 Expand All Balance Sheet Alumbers in thousands Get access to 40 years of historical data with Yahoo Finance Premium. Learn more ONE LOCATION FOR ALL YOUR NEEDS PLAN YOUR TRIP Breakdown 6/30/2020 6/30/2019 6/30/2018 6/30/2017 115.095,000 118,310.000 120,700.000 73.822.000 46.878,000 120.406,000 54,628,000 67.516.000 Total Assets > Tocal Liabities Net Minority In... Total Equity Gross Minority inte Total Capitalization 65.427000 Premiu reqi Leary yahoon Trade like it's not your first rodeo 47.579.000 52.883.000 55,778.000 73,184.000 70,050.000 67.565,000 73.071.000 Preferred Stock Equity 897,000 928.000 967,000 1,000,000 54,178.000 45.624,000 46 266,000 51,326.000 Common Stock Equity Capital Lease Obligation People Also Watch Symbol Le JNJ 156.10 GS2.000 33,000 51.000 107.000 16.714,000 3.03 1.98% 17.172.000 17.294,000 13.702,000 Net Tangible Assets Working Capital 4.989.000 7.538.000 4917.000 3.716.000 *0.85 +1.70% 30,344,000 82.505.000 85.719.000 50.79 Coca-Cola Company (The MRK 73.13 Merck a company, Inc VZ 56,00 76.325.000 18.222.000 -0.96 *1.33% 18.000.000 17.751.000 14,700.000 -2.199 35.372.000 30.092,000 31.26.000 11.592.000 25.020.000 211.610.000 Invested Capital Tangle Book Value Total Debt Net Debt Share issued Ordinary Shares Number Treasury Shares Number 25.972.000 PEP 133.03 14.20 28,539,000 4.009,200 4,009,251 4,009.293 2.498 093 4,009 200 2,553,300 2.479,700 2.504.751 Earnings > Contenuss 1.529,500 1.504.500 1.511.200 1,455,900 1.00 1.00 O 140 *Expand All Cash Flow All numbers in thousands Get access to 40+ years of historical data with Yahoo Finance Premium. Learn more TTM 6/30/2020 6/30/2019 6/30/2018 6/30/ 19.033.000 17,403.000 15.242,000 14,867,000 12.753 2,762,000 3.045.000 3.490.000 3.511.000 -5,689 -10,625.000 -8.367.000 -9.994,000 -14.375.000 8.56 11,925.000 16,181,000 4,239.000 2.569.000 5.569 Breakdown > Operating Cash Flow > Investing Cash Flow > Financing Cash Flow > End Cash Position Income Tax Paid Supplemental Data Interest Paid Supplemental Data Capital Expenditure Issuance of Debt Repayment of Debt Repurchase of Capital Stock 3,550.000 3,064.000 2.830.000 3.714 434,000 497,000 529.000 518 2.806.000 3,073.000 3.347.000 -3.717.000 3.384 7,380,000 4.951.000 2.367,000 5.072.000 3,603 -8,471.000 2.447.000 969.000 -2.873.000 4,931 -5,909.000 -7,405.000 -5,003.000 -7.004.000 -5.204 Free Cash Flow 16,227,000 14,330,000 11,895,000 11.150.000 9.369 I. Ratios for credit decision: current ratio, acid-test (quick) ratio, accounts receivable turnover, inventory turnover, days' sales uncollected*, days' sales in inventory*, debt ratio, equity ratio*, debt to equity ratio, interest coverage (times interest earned) II. Ratios for investment decision: net profit margin, gross margin ratio, return on (total) assets, return on equity, basic earnings per share*, dividends yield*, price earnings ratio*, total asset turnover* Dow 30 Chart SYMBOL NAME PRICE CHANGE XCHANGE : LOW HIGH PR Q PG Procter & Gamble Co 138.85 +0.22 +0.16 138.39 140.17 I. Ratios for credit decision: current ratio, acid-test (quick) ratio, accounts receivable turnover, inventory turnover, days' sales uncollected*, days' sales in inventory*, debt ratio, equity ratio*, debt to equity ratio, interest coverage (times interest earned) II. Ratios for investment decision: net profit margin, gross margin ratio, return on (total) assets, return on equity, basic earnings per share*, dividends yield*, price earnings ratio*, total asset turnover* Dow 30 Chart SYMBOL NAME PRICE CHANGE XCHANGE LOW HIGH PR PG Procter & Gamble Co 138.85 +0.22 +0.16 138.39 140.17 Income Statement Brown TTM 70.000 630/2020 7:55:00 1.200.000 20/2015 34300 TE000 Case of 1.000 17902.000 fratrodo 1.000 10.000 People Also Watch 256.000 000 000 TAL 5.834,00 1.70 3.000 000 271.000 754.000 104000 > Common Scho Dags No Como 24 14.000 27.000 750.00 1.634.000 GOS 0.005 17.00 encontro con 0.500 300 310.000 255.000 7.000 Recorded the 2.000 25.000 20.000 LOL.300 4.000 204300 2:00 2.400 2 Netcome from MA asso 11147 000 Expand All Balance Sheet Alumbers in thousands Get access to 40 years of historical data with Yahoo Finance Premium. Learn more ONE LOCATION FOR ALL YOUR NEEDS PLAN YOUR TRIP Breakdown 6/30/2020 6/30/2019 6/30/2018 6/30/2017 115.095,000 118,310.000 120,700.000 73.822.000 46.878,000 120.406,000 54,628,000 67.516.000 Total Assets > Tocal Liabities Net Minority In... Total Equity Gross Minority inte Total Capitalization 65.427000 Premiu reqi Leary yahoon Trade like it's not your first rodeo 47.579.000 52.883.000 55,778.000 73,184.000 70,050.000 67.565,000 73.071.000 Preferred Stock Equity 897,000 928.000 967,000 1,000,000 54,178.000 45.624,000 46 266,000 51,326.000 Common Stock Equity Capital Lease Obligation People Also Watch Symbol Le JNJ 156.10 GS2.000 33,000 51.000 107.000 16.714,000 3.03 1.98% 17.172.000 17.294,000 13.702,000 Net Tangible Assets Working Capital 4.989.000 7.538.000 4917.000 3.716.000 *0.85 +1.70% 30,344,000 82.505.000 85.719.000 50.79 Coca-Cola Company (The MRK 73.13 Merck a company, Inc VZ 56,00 76.325.000 18.222.000 -0.96 *1.33% 18.000.000 17.751.000 14,700.000 -2.199 35.372.000 30.092,000 31.26.000 11.592.000 25.020.000 211.610.000 Invested Capital Tangle Book Value Total Debt Net Debt Share issued Ordinary Shares Number Treasury Shares Number 25.972.000 PEP 133.03 14.20 28,539,000 4.009,200 4,009,251 4,009.293 2.498 093 4,009 200 2,553,300 2.479,700 2.504.751 Earnings > Contenuss 1.529,500 1.504.500 1.511.200 1,455,900 1.00 1.00 O 140 *Expand All Cash Flow All numbers in thousands Get access to 40+ years of historical data with Yahoo Finance Premium. Learn more TTM 6/30/2020 6/30/2019 6/30/2018 6/30/ 19.033.000 17,403.000 15.242,000 14,867,000 12.753 2,762,000 3.045.000 3.490.000 3.511.000 -5,689 -10,625.000 -8.367.000 -9.994,000 -14.375.000 8.56 11,925.000 16,181,000 4,239.000 2.569.000 5.569 Breakdown > Operating Cash Flow > Investing Cash Flow > Financing Cash Flow > End Cash Position Income Tax Paid Supplemental Data Interest Paid Supplemental Data Capital Expenditure Issuance of Debt Repayment of Debt Repurchase of Capital Stock 3,550.000 3,064.000 2.830.000 3.714 434,000 497,000 529.000 518 2.806.000 3,073.000 3.347.000 -3.717.000 3.384 7,380,000 4.951.000 2.367,000 5.072.000 3,603 -8,471.000 2.447.000 969.000 -2.873.000 4,931 -5,909.000 -7,405.000 -5,003.000 -7.004.000 -5.204 Free Cash Flow 16,227,000 14,330,000 11,895,000 11.150.000 9.369
Step by Step Solution
There are 3 Steps involved in it

Get step-by-step solutions from verified subject matter experts