

Question: Help BAutoSave OFF Layout References www Math 111 Exam1 Fall 2022 Act Tell me Mailings Review View View Math 111 Exam 1 Fall 2022
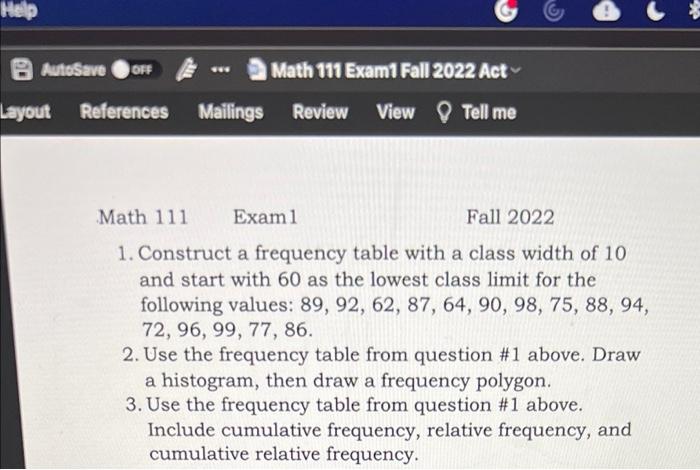
Help BAutoSave OFF Layout References www Math 111 Exam1 Fall 2022 Act Tell me Mailings Review View View Math 111 Exam 1 Fall 2022 1. Construct a frequency table with a class width of 10 and start with 60 as the lowest class limit for the following values: 89, 92, 62, 87, 64, 90, 98, 75, 88, 94, 72, 96, 99, 77, 86. 2. Use the frequency table from question #1 above. Draw a histogram, then draw a frequency polygon. 3. Use the frequency table from question #1 above. Include cumulative frequency, relative frequency, and cumulative relative frequency. *
Step by Step Solution
3.46 Rating (172 Votes )
There are 3 Steps involved in it
Step 1 Frequency It is the number of happening of a repeating event per unit of time The frequency i... View full answer

Get step-by-step solutions from verified subject matter experts