

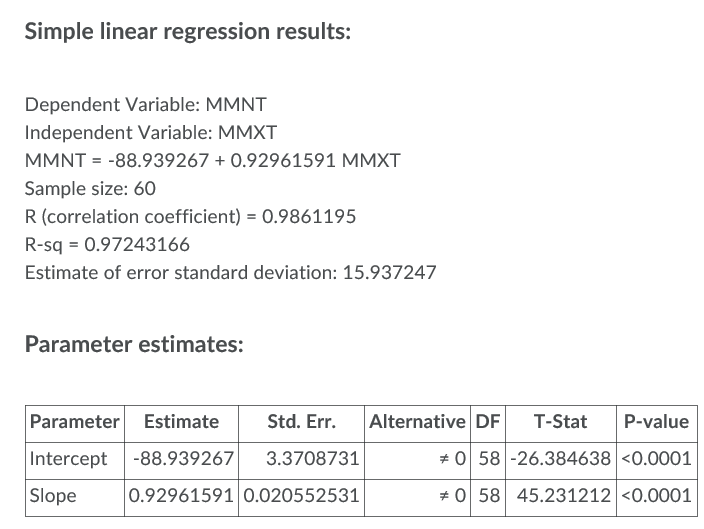
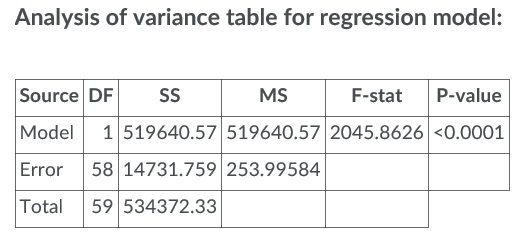
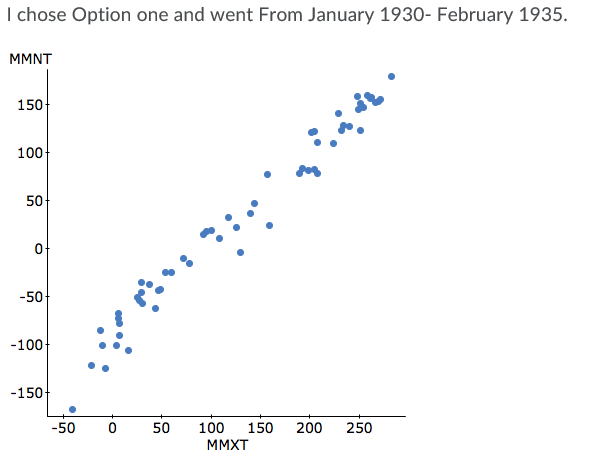
Question: Help! Below is a weatherscatter plot that representsMonthly Minimum Temperature (MMNT) and Monthly Maximum Temperature (MMXT). Possibly discuss the relationships between the scatter plot, the
Help! Below is a weatherscatter plot that representsMonthly Minimum Temperature (MMNT) and Monthly Maximum Temperature (MMXT). Possibly discuss the relationships between the scatter plot, the correlation coefficient, and the linear regression equation for the sample.
\f\f\f
Step by Step Solution
There are 3 Steps involved in it
1 Expert Approved Answer
Step: 1 Unlock

Question Has Been Solved by an Expert!
Get step-by-step solutions from verified subject matter experts
Step: 2 Unlock
Step: 3 Unlock