

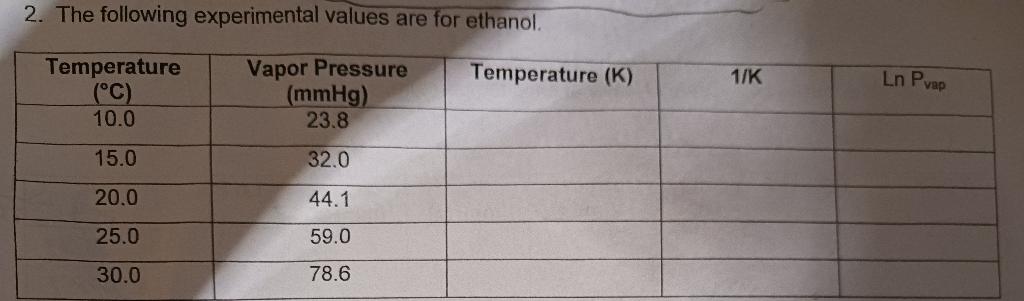
Question: Help Complete table with step by step solution and graph 2. The following experimental values are for ethanol. Graph the data as shown in the
 Help Complete table with step by step solution and graph
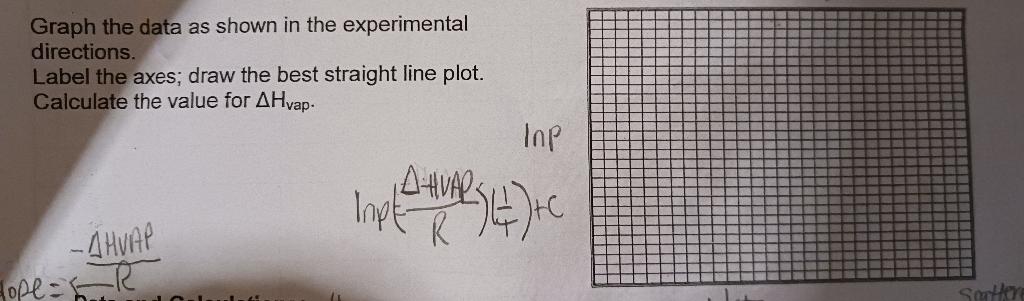
2. The following experimental values are for ethanol. Graph the data as shown in the experimental directions. Label the axes; draw the best straight line plot. Calculate the value for Hvap. lnp lnp(RHUAP)(41)+C
Step by Step Solution
There are 3 Steps involved in it
1 Expert Approved Answer
Step: 1 Unlock

Question Has Been Solved by an Expert!
Get step-by-step solutions from verified subject matter experts
Step: 2 Unlock
Step: 3 Unlock