

Question: help doing this assignment Assignment 6: Hypothesis Tests In this assignment, assume the data is normally distributed. You will need to decide which hypothesis test
help doing this assignment
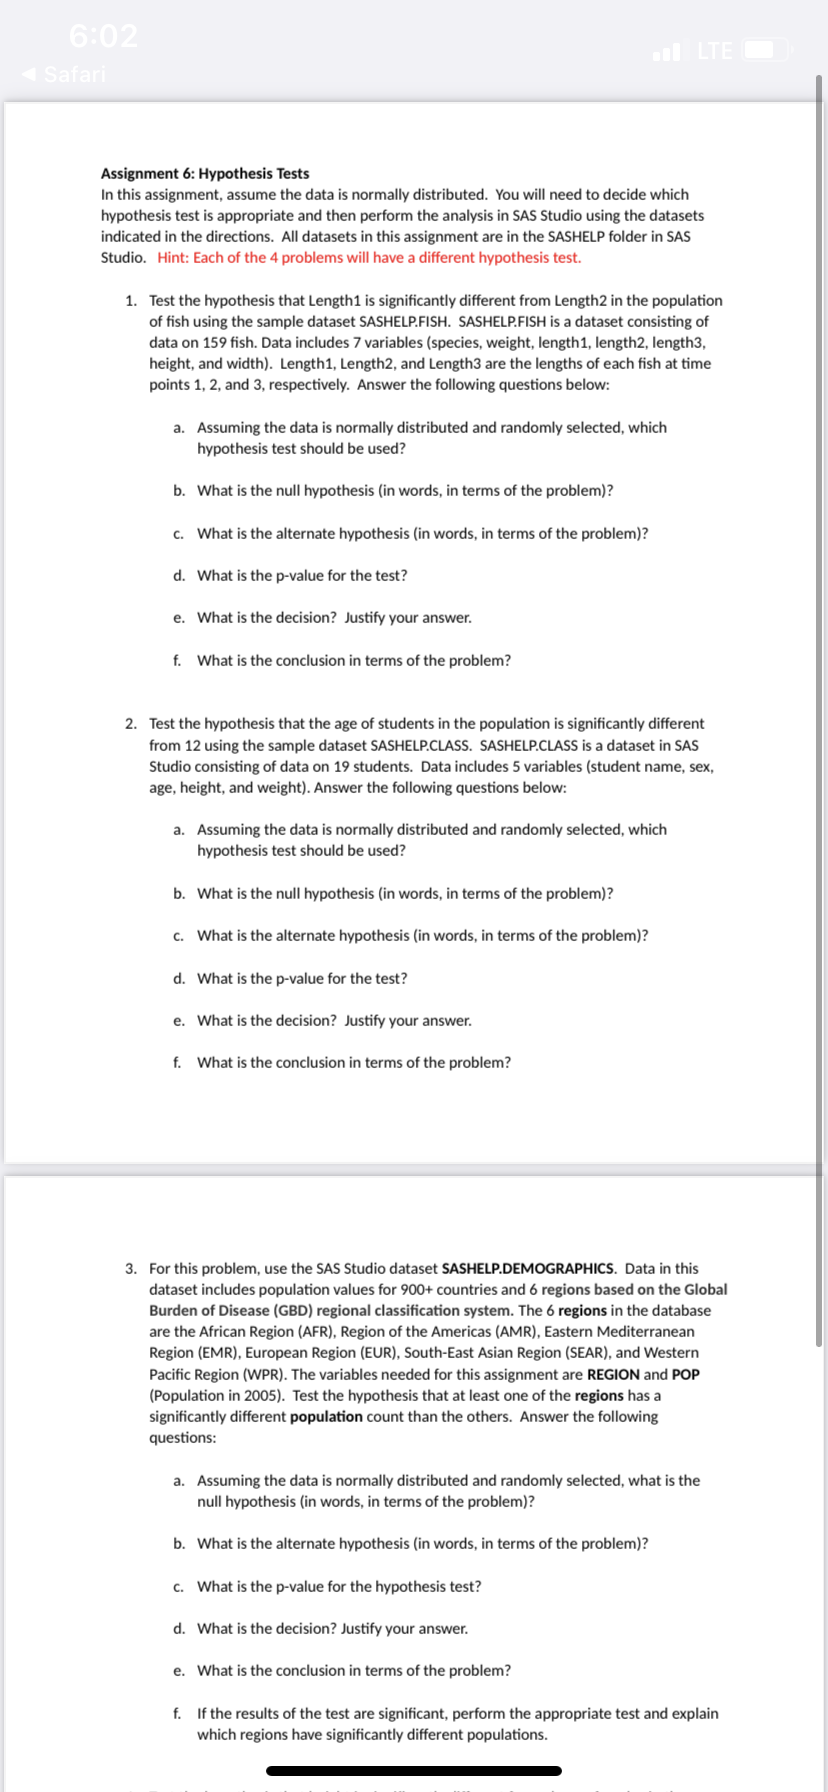

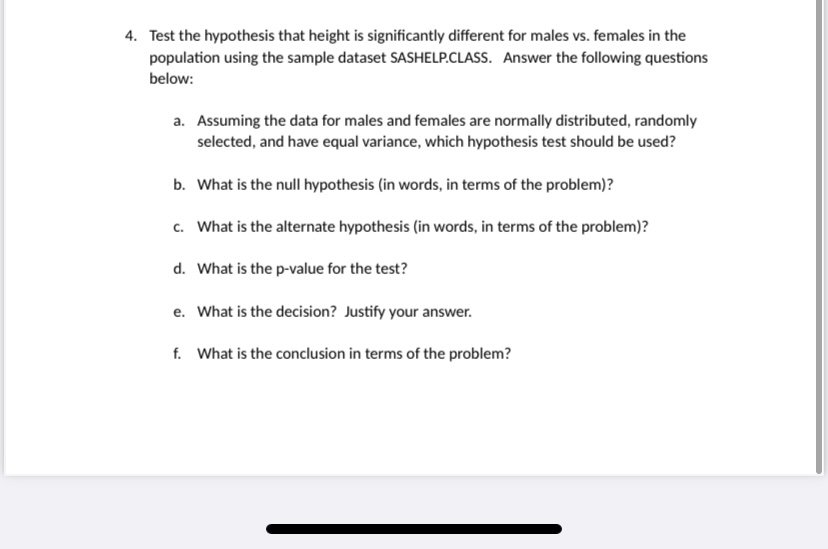
Assignment 6: Hypothesis Tests In this assignment, assume the data is normally distributed. You will need to decide which hypothesis test is appropriate and then perform the analysis in SAS Studio using the dataset: indicated in the directions. All datasets in this assignment are in the SASHELP folder in SAS Studio. Hint: Each of the 4 problems will have a different hypothesis test. 1. Test the hypothesis that Lengthi is significantly different from length2 in the population offish using the sample dataset SASHELPIISH. SASHELRFISH is a dataset consisting of data on 159 fish. Data includes 7 variables (species. weight. lengtht. length2. lengths. height. and width). Length1. Length2, and Lengths are the lengths of each fish at time points 1. 2, and 3, respectively. Answer the following questions below: a. Assuming the data is normally distributed and randomly selected. which hypothesis test should be used? b. What is the null hypothesis lin words, in terms of the problem)? c. What is the alternate hypothesis tin words. in terms of the problem)? d. What is the mine for the test? e. What is the decision? Justify your answer. f. What is the conclusion in terms of the problem? 2. Test the hypothesis that the age of students in the population is significantly different from 12 using the sample dataset SASHELECLASS. SASHELRCLASS is a dataset in SAS Studio consistingof data on 19 students. Data includes 5 variables (student name, sex. age, height, and weight). Answer the following questions below: a. Assuming the data is normally distributed and randomly selected. which hypothesis test should be used? b. What is the null hypothesis [in words. in terms of the problem)? c. What is the alternate hypothesis tin words. in terms of the problem)? d. What is the pwalue for the test? e. What is the decision? Justify your answer. f. What is the conclusion in terms of the problem? 3. For this problem. use the SAS Studio dataset mmDEMDGRAPl-llcs. Data in this dataset includes population values for 900+ countries and 6 regions based on the Global Eudor- of Disease (GED) regional classication system. The 6 regions in the database are the African Region iAFRI. Raglan of the Americas (AMR). Eastern Mediterranean Region (EMR). European Region (EUR), South-East Asian Region (SEAR), and Western Pacic Region i'WPR). The variables needed forthis assignment are REGION and POP (Population in 2005). Test the hypothesis that at least one of the regions has a signiicantly different population count than the others. Answer the following questions: a. Assuming the data is normally distributed and randomly selected. what is the null hypothesis {in words. in terms of the problem)? b. What is the alternate hypothesis tin words. in terms of the problem)? c. What is the pwalue for the hypothesis test? d. What is the decision? Justify your answer. e. What is the conclusion in terms of the problem? f. If the results of the test are significant, perform the appropriate test and explain which regions have significantly different populations. 7:17 DO LTE b. What is the null hypothesis (in words, in terms of the problem)? c. What is the alternate hypothesis (in words, in terms of the problem)? d. What is the p-value for the test? e. What is the decision? Justify your answer. f. What is the conclusion in terms of the problem? 3. For this problem, use the SAS Studio dataset SASHELP.DEMOGRAPHICS. Data in this dataset includes population values for 900+ countries and 6 regions based on the Global Burden of Disease (GBD) regional classification system. The 6 regions in the database are the African Region (AFR), Region of the Americas (AMR), Eastern Mediterranean Region (EMR), European Region (EUR), South-East Asian Region (SEAR), and Western Pacific Region (WPR). The variables needed for this assignment are REGION and POP (Population in 2005). Test the hypothesis that at least one of the regions has a significantly different population count than the others. Answer the following questions: a. Assuming the data is normally distributed and randomly selected, what is the null hypothesis (in words, in terms of the problem)? b. What is the alternate hypothesis (in words, in terms of the problem)? c. What is the p-value for the hypothesis test? d. What is the decision? Justify your answer. e. What is the conclusion in terms of the problem? If the results of the test are significant, perform the appropriate test and explain which regions have significantly different populations. 4. Test the hypothesis that height is significantly different for males vs. females in the population using the sample dataset SASHELP.CLASS. Answer the following questions below: a. Assuming the data for males and females are normally distributed, randomly selected, and have equal variance, which hypothesis test should be used? b. What is the null hypothesis (in words, in terms of the problem)? Copy Share Favorite O Show in All Photos Delete from Library4. Test the hypothesis that height is significantly different for males vs. females in the population using the sample dataset SASHELP.CLASS. Answer the following questions below: a. Assuming the data for males and females are normally distributed, randomly selected, and have equal variance, which hypothesis test should be used? b. What is the null hypothesis (in words, in terms of the problem)? c. What is the alternate hypothesis (in words, in terms of the problem)? d. What is the p-value for the test? e. What is the decision? Justify your answer. f. What is the conclusion in terms of the
Step by Step Solution
There are 3 Steps involved in it

Get step-by-step solutions from verified subject matter experts