

Question: help (graphs) E(R1)=0.12E(R2)=0.16E(1)=0.04E(2)=0.07 Calculate the expected retums and expected standard deviations of a two-stock portfolio having a correlation coefficient of 0.60 under the conditions given
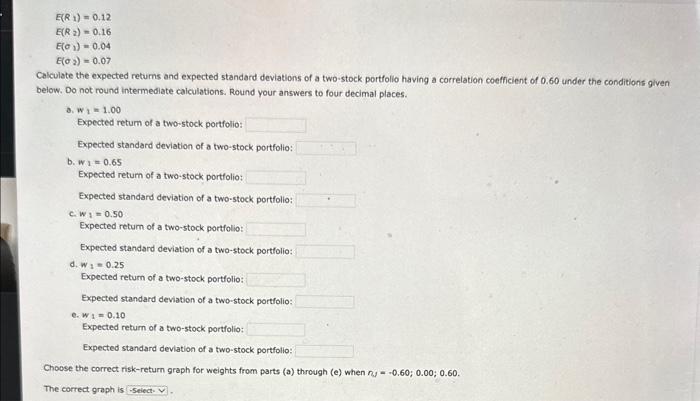
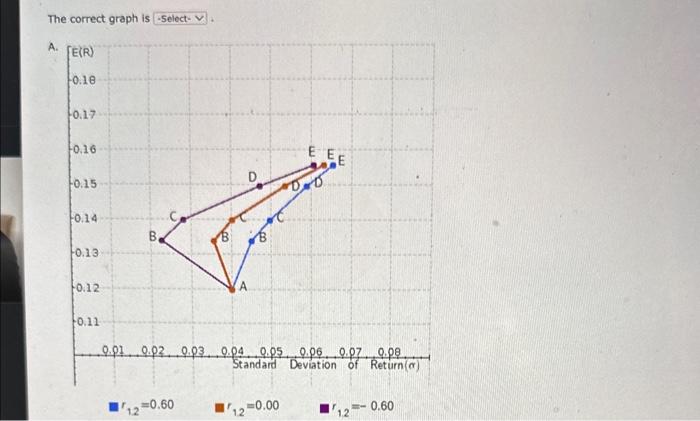
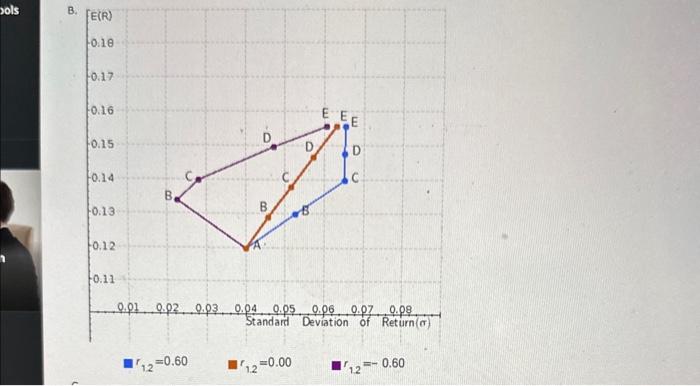
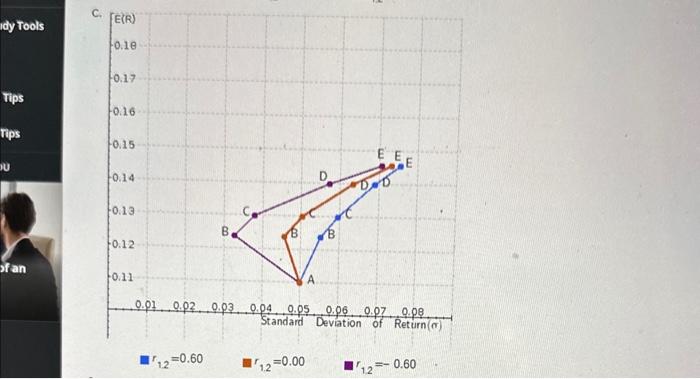
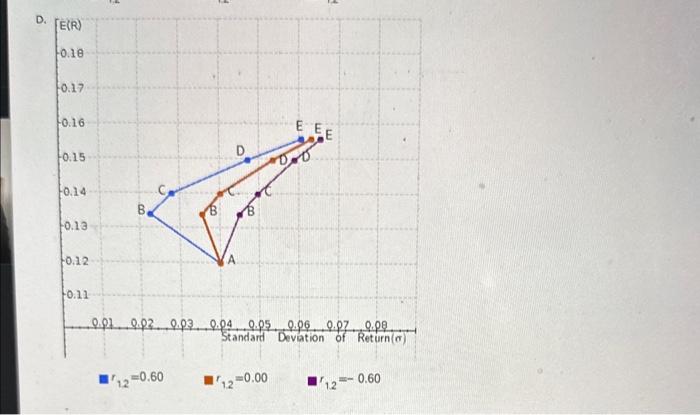
E(R1)=0.12E(R2)=0.16E(1)=0.04E(2)=0.07 Calculate the expected retums and expected standard deviations of a two-stock portfolio having a correlation coefficient of 0.60 under the conditions given below. Do not round intermediate calculations. Round your answers to four decimal places. a. w1=1.00 Expected return of a two-stock portfolio: Expected standard deviation of a two-stock portfolio: b. w1=0.65 Expected retum of a two-stock portfolio: Expected standard deviation of a two-stock portfolio: c. w1=0.50 Expected retum of a two-stock portfolio: Expected standard deviation of a two-stock portfolio: a. W1=0.25 Expected retum of a two-stock portfolio: Expected standard deviation of a two-stock portfolio: e. w1=0.10 Expected return of a two-stock portfolio: Expected standard deviation of a two-stock portfolio: Choose the correct risk-return graph for weights from parts (a) through (e) when aj=0.60;0.00;0.60. The correct graph is The correct graph is r1.2=0.60r1.2=0.00r1.2=0.60 r1.2=0.00r1.2=0.60 r1.2=0.60=0.00r1.2=0.60 r12=0.60
Step by Step Solution
There are 3 Steps involved in it

Get step-by-step solutions from verified subject matter experts