Question: HELP! How to do graphs with this table? Do it by hand in a paper please! do at least 3 Problem 1: Complete exercises 2.9.

HELP! How to do graphs with this table? Do it by hand in a paper please! do at least 3HELP! How to do graphs with this table? Do it by

Problem 1: Complete exercises 2.9. You should come up with many visuals (at least 6). In addition to the values given in the book, you make assume the averages given in the table below. Average Time To Close Deal (days) Direct Indirect Total Product Sales Sales Sales A 83 145 128 B 54 131 127 C 89 122 107 D 90 129 118 Average 78 134 122

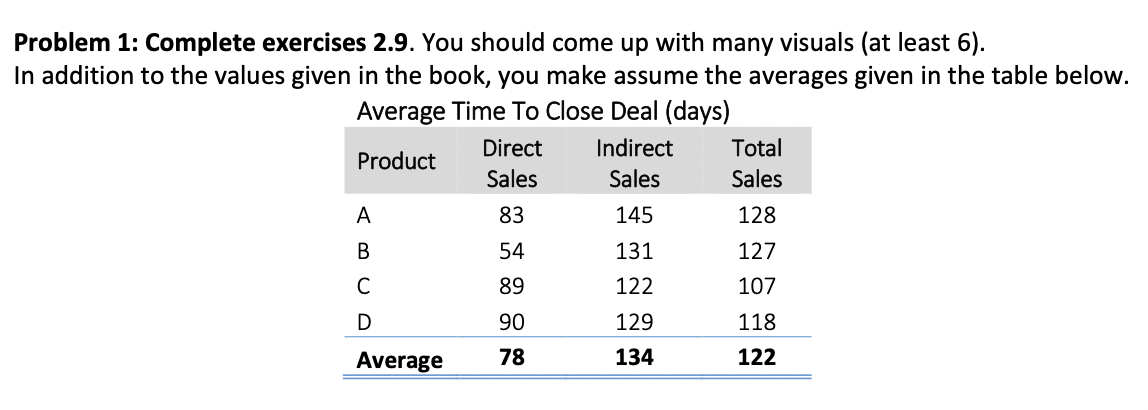
Step by Step Solution

There are 3 Steps involved in it

1 Expert Approved Answer
Step: 1 Unlock blur-text-image
Question Has Been Solved by an Expert!

Get step-by-step solutions from verified subject matter experts

Step: 2 Unlock
Step: 3 Unlock

Students Have Also Explored These Related General Management Questions!