

Question: Help im having trouble drawing a plit profile The Plot In total, the profile for the road requires 6 lines: 3 design grades (the centerline,
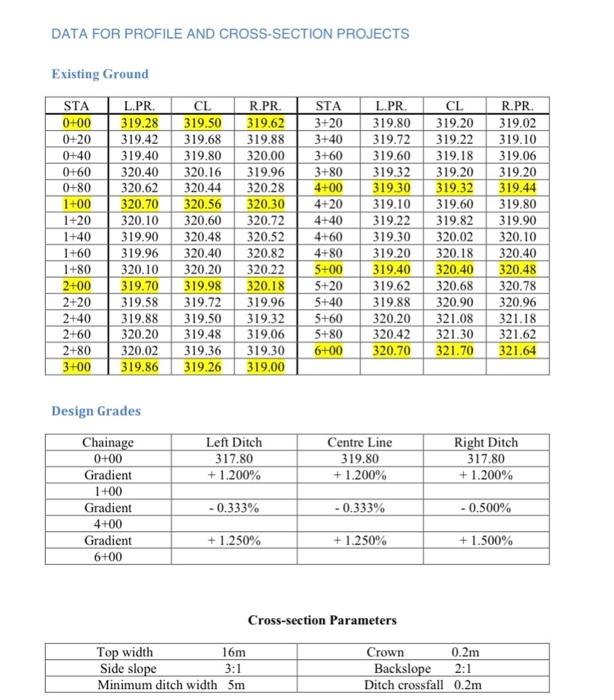
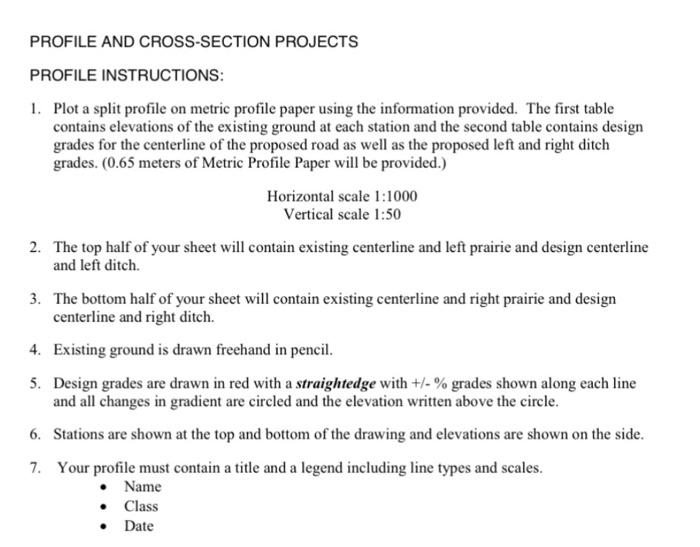
The Plot In total, the profile for the road requires 6 lines: 3 design grades (the centerline, plus the left and right ditches), and three existing ground lines (the centerline, plus the left and right prairie lines). In practice plotting all these lines on one plot becomes very confusing as they tend to overlap quite a bit. Therefore, we split the profile into two separate parts to create a more legible, less cluttered drawing. One half of the profile contains existing and design centerline and the left prairie and design ditch lines (50 4 lines total, 2 design and 2 existing ground) and the other half contains existing and design centerline and the right prairie and ditch lines (again, 4 lines in total). In other words, one profile shows the data on the left side of centerline, and the other shows the data on the right side of centerline. The centerline data (both design and existing) is shown on both plots. Follow the instructions on page 110 for plotting the split profile. Remember to use freehand lines to represent existing ground and straight-edge for design grades. Use unique linetypes for each line and replicate these in the legend. You may want to use linetypes such as dash, dash-dot, centerline or solid. Freehand and straight-edge are considered two unique linetypes as are pencil and red pen. Begin the project by setting up the axes using the appropriate scales and noting the elevation range to be included. (i.e. do not start the elevations at 0 or you will need a lot more paper!). Line up the two profiles one over the other so the stations match (usually the left side is shown on the top half of the paper, and the right side is shown on the bottom half). In other words, set up the plots 50 your " 0+00 for both plots is on the same grid line. See also notes on the plot paper below. Summary of Important Points - Split Profile Plot - Plot elevation on vertical axis, station on horizontal axis - Note the appropriate scale for each axis - All existing ground frechand in pencil; plot points from table no calculations required - All design points in red, design grades drawn in red with a straight edge - Cirele all design points - For each design line, label the elevation for each critical point, and the grade for each section of line - Use different linetypes for each of the four types (eg centerline, eg prairie, design cl, design ditch) - Each axis must be labelled (see example below) - Each axis must have a title (Elevation and Station would be fine) - The plot must have a "title block" somewhere on it that doesn't conflict with your data Module 1: Construction Drawings Lesson 2: Split Profile Project Learning Outcomes: After completing this lesson, you should be able to: Complete a hand-drawn split profile. Calculate critical elevation of grade changes for road centerline and ditches Plot a split profile containing existing ground and design grades Reading Assignment: Surveying Lecture Notes Chapter 7 pp 110-111 Lesson Notes: Split Profile Project Overview: The instructions for the Split Profile Project are contained on page 110 and 111 of the Surveying Lecture Notes under "Profile Instructions". Ignore the cross-section portion of this project: it will be covered in a later lesson. Both the Split Profile Project and the Cross-Section Project are based on the same 600 meter section of roadway. The data and parameters for both projects are found on page 111. The Existing Ground table contains three elevations for each station, left and right prairie and centerline. These elevations represent the centerline and the outer limits of the rightof-way perpendicular to the profile or centerline. Calculations The design grades in the second table represent the design profile line for the centerline and the ditch on either side of the centerline. Each design grade lies has its own gradient based on the topography of the area. The table is set up for you to calculate the elevations at the critical stations where major grade changes occur. There are three elevations to calculate for each design profile line. DATA FOR PROFILE AND CROSS-SECTION PROJECTS Existing Ground Design Grades Cross-section Parameters PROFILE AND CROSS-SECTION PROJECTS PROFILE INSTRUCTIONS: 1. Plot a split profile on metric profile paper using the information provided. The first table contains elevations of the existing ground at each station and the second table contains design grades for the centerline of the proposed road as well as the proposed left and right ditch grades. ( 0.65 meters of Metric Profile Paper will be provided.) Horizontal scale 1:1000 Vertical scale 1:50 2. The top half of your sheet will contain existing centerline and left prairie and design centerline and left ditch. 3. The bottom half of your sheet will contain existing centerline and right prairie and design centerline and right ditch. 4. Existing ground is drawn freehand in pencil. 5. Design grades are drawn in red with a straightedge with +/% grades shown along each line and all changes in gradient are circled and the elevation written above the circle. 6. Stations are shown at the top and bottom of the drawing and elevations are shown on the side. 7. Your profile must contain a title and a legend including line types and scales. - Name - Class - Date The Plot In total, the profile for the road requires 6 lines: 3 design grades (the centerline, plus the left and right ditches), and three existing ground lines (the centerline, plus the left and right prairie lines). In practice plotting all these lines on one plot becomes very confusing as they tend to overlap quite a bit. Therefore, we split the profile into two separate parts to create a more legible, less cluttered drawing. One half of the profile contains existing and design centerline and the left prairie and design ditch lines (50 4 lines total, 2 design and 2 existing ground) and the other half contains existing and design centerline and the right prairie and ditch lines (again, 4 lines in total). In other words, one profile shows the data on the left side of centerline, and the other shows the data on the right side of centerline. The centerline data (both design and existing) is shown on both plots. Follow the instructions on page 110 for plotting the split profile. Remember to use freehand lines to represent existing ground and straight-edge for design grades. Use unique linetypes for each line and replicate these in the legend. You may want to use linetypes such as dash, dash-dot, centerline or solid. Freehand and straight-edge are considered two unique linetypes as are pencil and red pen. Begin the project by setting up the axes using the appropriate scales and noting the elevation range to be included. (i.e. do not start the elevations at 0 or you will need a lot more paper!). Line up the two profiles one over the other so the stations match (usually the left side is shown on the top half of the paper, and the right side is shown on the bottom half). In other words, set up the plots 50 your " 0+00 for both plots is on the same grid line. See also notes on the plot paper below. Summary of Important Points - Split Profile Plot - Plot elevation on vertical axis, station on horizontal axis - Note the appropriate scale for each axis - All existing ground frechand in pencil; plot points from table no calculations required - All design points in red, design grades drawn in red with a straight edge - Cirele all design points - For each design line, label the elevation for each critical point, and the grade for each section of line - Use different linetypes for each of the four types (eg centerline, eg prairie, design cl, design ditch) - Each axis must be labelled (see example below) - Each axis must have a title (Elevation and Station would be fine) - The plot must have a "title block" somewhere on it that doesn't conflict with your data Module 1: Construction Drawings Lesson 2: Split Profile Project Learning Outcomes: After completing this lesson, you should be able to: Complete a hand-drawn split profile. Calculate critical elevation of grade changes for road centerline and ditches Plot a split profile containing existing ground and design grades Reading Assignment: Surveying Lecture Notes Chapter 7 pp 110-111 Lesson Notes: Split Profile Project Overview: The instructions for the Split Profile Project are contained on page 110 and 111 of the Surveying Lecture Notes under "Profile Instructions". Ignore the cross-section portion of this project: it will be covered in a later lesson. Both the Split Profile Project and the Cross-Section Project are based on the same 600 meter section of roadway. The data and parameters for both projects are found on page 111. The Existing Ground table contains three elevations for each station, left and right prairie and centerline. These elevations represent the centerline and the outer limits of the rightof-way perpendicular to the profile or centerline. Calculations The design grades in the second table represent the design profile line for the centerline and the ditch on either side of the centerline. Each design grade lies has its own gradient based on the topography of the area. The table is set up for you to calculate the elevations at the critical stations where major grade changes occur. There are three elevations to calculate for each design profile line. DATA FOR PROFILE AND CROSS-SECTION PROJECTS Existing Ground Design Grades Cross-section Parameters PROFILE AND CROSS-SECTION PROJECTS PROFILE INSTRUCTIONS: 1. Plot a split profile on metric profile paper using the information provided. The first table contains elevations of the existing ground at each station and the second table contains design grades for the centerline of the proposed road as well as the proposed left and right ditch grades. ( 0.65 meters of Metric Profile Paper will be provided.) Horizontal scale 1:1000 Vertical scale 1:50 2. The top half of your sheet will contain existing centerline and left prairie and design centerline and left ditch. 3. The bottom half of your sheet will contain existing centerline and right prairie and design centerline and right ditch. 4. Existing ground is drawn freehand in pencil. 5. Design grades are drawn in red with a straightedge with +/% grades shown along each line and all changes in gradient are circled and the elevation written above the circle. 6. Stations are shown at the top and bottom of the drawing and elevations are shown on the side. 7. Your profile must contain a title and a legend including line types and scales. - Name - Class - Date
Step by Step Solution
There are 3 Steps involved in it

Get step-by-step solutions from verified subject matter experts