

Question: help me answer activity 1 and 2 plsss b. Construct the sampling distribution of the sample means. Sample Mean Probability Frequency c. Draw a histogram
help me answer activity 1 and 2 plsss
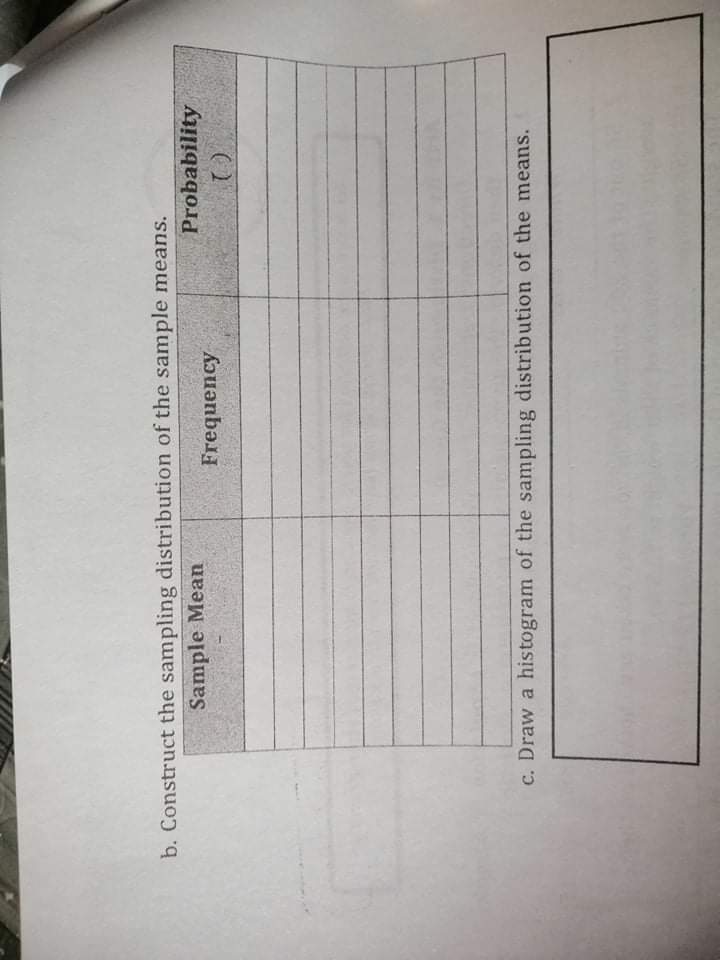
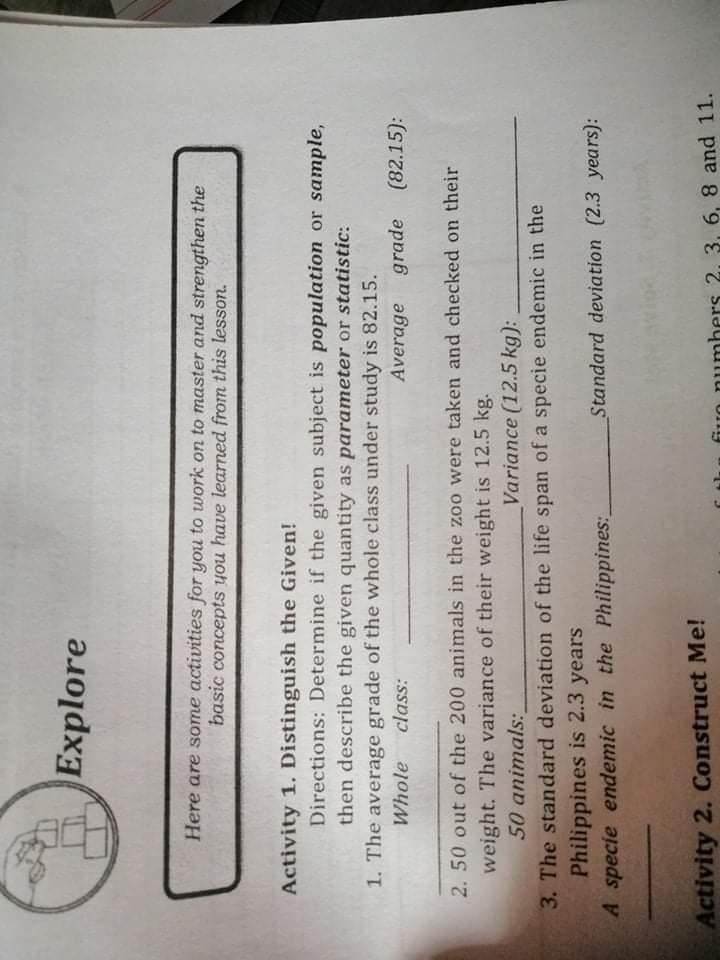
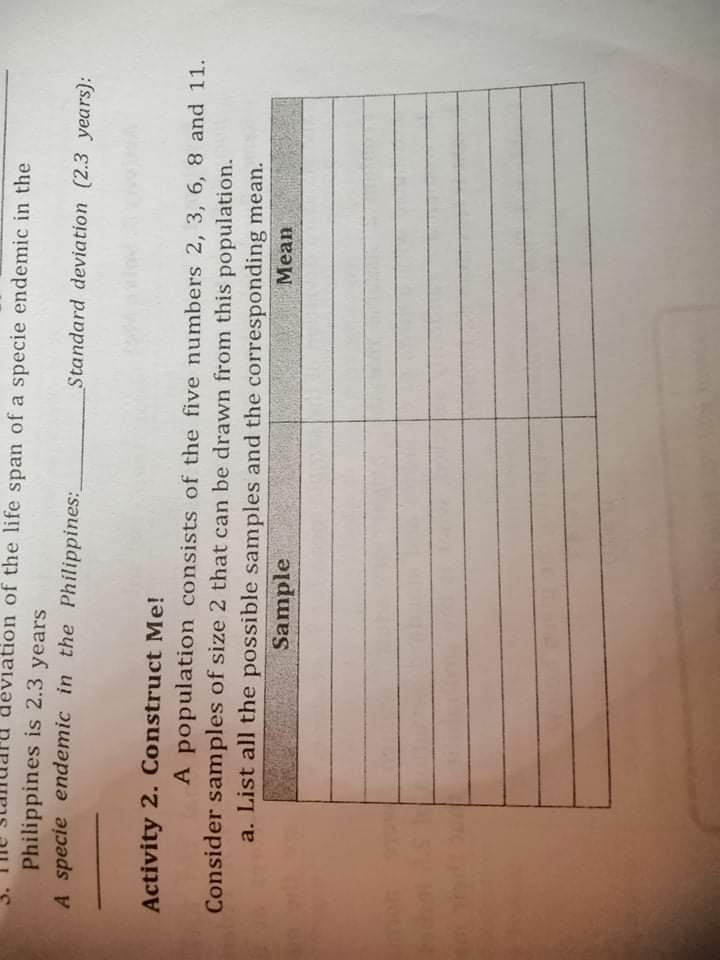
b. Construct the sampling distribution of the sample means. Sample Mean Probability Frequency c. Draw a histogram of the sampling distribution of the means.Explore Here are some activities for you to work on to master and strengthen the basic concepts you have learned from this lesson. Activity 1. Distinguish the Given! Directions: Determine if the given subject is population or sample, then describe the given quantity as parameter or statistic: 1. The average grade of the whole class under study is 82.15. Whole class: Average grade (82.15): 2. 50 out of the 200 animals in the zoo were taken and checked on their weight. The variance of their weight is 12.5 kg. 50 animals: Variance (12.5 kg): 3. The standard deviation of the life span of a specie endemic in the Philippines is 2.3 years A specie endemic in the Philippines: Standard deviation (2.3 years): Activity 2. Construct Me! 's 2. 3. 6. 8 and 11.leviation of the life span of a specie endemic in the Philippines is 2.3 years A specie endemic in the Philippines: Standard deviation (2.3 years): Activity 2. Construct Me! A population consists of the five numbers 2, 3, 6, 8 and 11. Consider samples of size 2 that can be drawn from this population. a. List all the possible samples and the corresponding mean. Sample Mean
Step by Step Solution
There are 3 Steps involved in it

Get step-by-step solutions from verified subject matter experts