

Question: help me do #1 in excel please Change the Lease detail figures to resemble a new completed development using the following data. The vacancy and
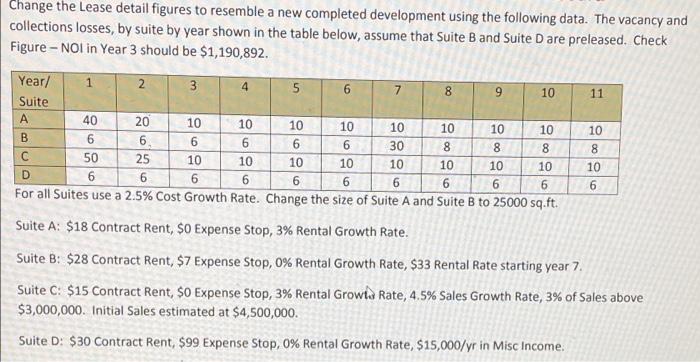
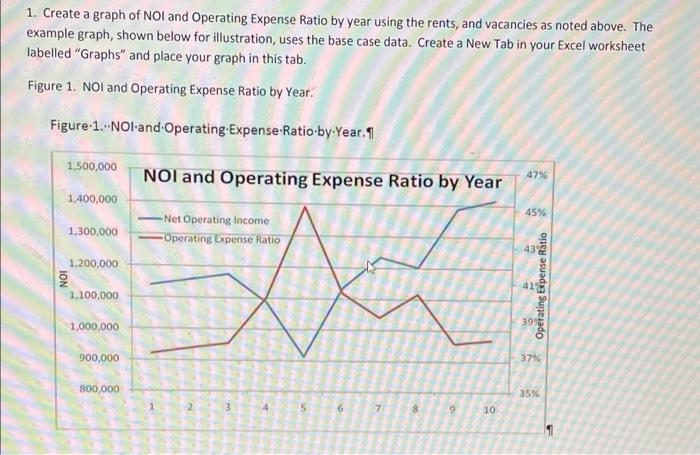
Change the Lease detail figures to resemble a new completed development using the following data. The vacancy and collections losses, by suite by year shown in the table below, assume that suite B and Suite D are preleased. Check Figure - Nol in Year 3 should be $1,190,892. - 2. 5 00 11 10 900 Year/ 1 2 3 4 5 6 7 8 9 10 Suite A 40 20 10 10 10 10 10 10 10 10 . 6 6. 6 6 6 30 8 8 50 25 10 10 10 10 10 10 10 10 D 6 6 6 6 6 6 6 6 For all Suites use a 2.5% Cost Growth Rate. Change the size of Suite A and Suite B to 25000 sq.ft. Suite A: $18 Contract Rent, $0 Expense Stop, 3% Rental owth Rate 90 90 o 0090 8 10 6 Suite B: $28 Contract Rent, $7 Expense Stop, 0% Rental Growth Rate, $33 Rental Rate starting year 7. Suite C: $15 Contract Rent, $o Expense Stop, 3% Rental Growls Rate, 4.5% Sales Growth Rate, 3% of Sales above $3,000,000. Initial Sales estimated at $4,500,000. Suite D: $30 Contract Rent, $99 Expense Stop, 0% Rental Growth Rate, $15,000/yr in Misc Income 1. Create a graph of NOI and Operating Expense Ratio by year using the rents, and vacancies as noted above. The example graph, shown below for illustration, uses the base case data. Create a New Tab in your Excel worksheet labelled "Graphs" and place your graph in this tab. Figure 1. NOI and Operating Expense Ratio by Year. Figure 1...NOI and Operating-Expense-Ratio by Year. 9 1,500,000 NOI and Operating Expense Ratio by Year 47% 1,400,000 45% 1,300,000 -Net Operating income Operating Expense Ratio 43 & 1,200,000 ION 41 Operating Expense Ratio 1.100,000 1,000,000 3995 900,000 37% 800,000 35% 2 3 4 5 6 7 8 9 10 1 Change the Lease detail figures to resemble a new completed development using the following data. The vacancy and collections losses, by suite by year shown in the table below, assume that suite B and Suite D are preleased. Check Figure - Nol in Year 3 should be $1,190,892. - 2. 5 00 11 10 900 Year/ 1 2 3 4 5 6 7 8 9 10 Suite A 40 20 10 10 10 10 10 10 10 10 . 6 6. 6 6 6 30 8 8 50 25 10 10 10 10 10 10 10 10 D 6 6 6 6 6 6 6 6 For all Suites use a 2.5% Cost Growth Rate. Change the size of Suite A and Suite B to 25000 sq.ft. Suite A: $18 Contract Rent, $0 Expense Stop, 3% Rental owth Rate 90 90 o 0090 8 10 6 Suite B: $28 Contract Rent, $7 Expense Stop, 0% Rental Growth Rate, $33 Rental Rate starting year 7. Suite C: $15 Contract Rent, $o Expense Stop, 3% Rental Growls Rate, 4.5% Sales Growth Rate, 3% of Sales above $3,000,000. Initial Sales estimated at $4,500,000. Suite D: $30 Contract Rent, $99 Expense Stop, 0% Rental Growth Rate, $15,000/yr in Misc Income 1. Create a graph of NOI and Operating Expense Ratio by year using the rents, and vacancies as noted above. The example graph, shown below for illustration, uses the base case data. Create a New Tab in your Excel worksheet labelled "Graphs" and place your graph in this tab. Figure 1. NOI and Operating Expense Ratio by Year. Figure 1...NOI and Operating-Expense-Ratio by Year. 9 1,500,000 NOI and Operating Expense Ratio by Year 47% 1,400,000 45% 1,300,000 -Net Operating income Operating Expense Ratio 43 & 1,200,000 ION 41 Operating Expense Ratio 1.100,000 1,000,000 3995 900,000 37% 800,000 35% 2 3 4 5 6 7 8 9 10 1
Step by Step Solution
There are 3 Steps involved in it

Get step-by-step solutions from verified subject matter experts