

Question: Help me learn how to study this for my midterm !! The table below gives the number of parking tickets received in one semester and
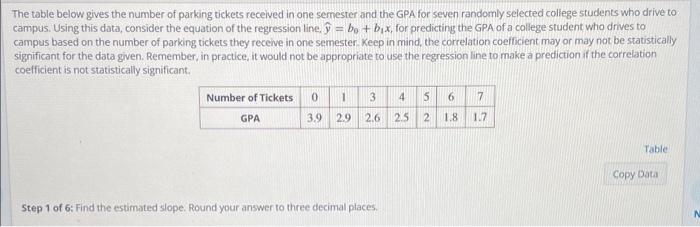
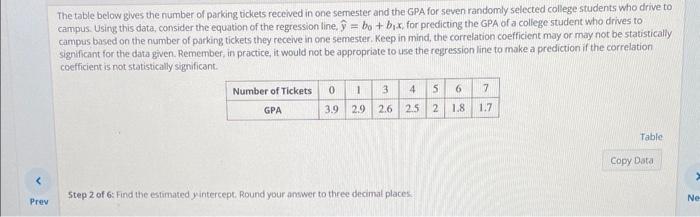
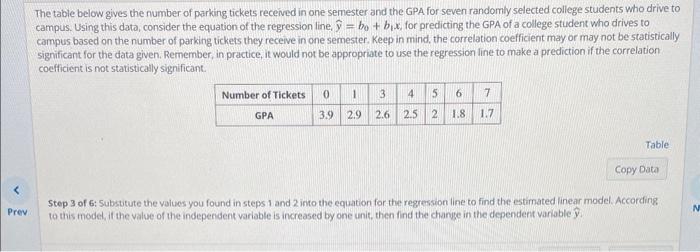
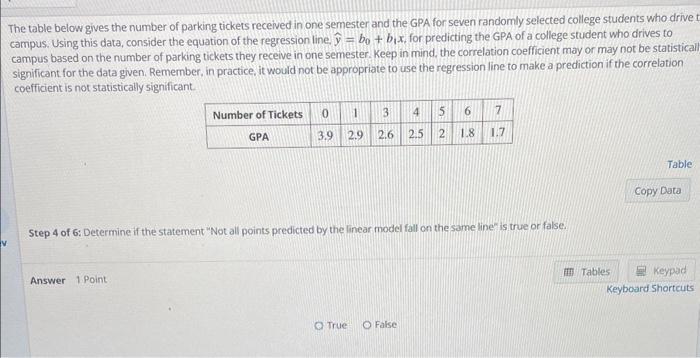
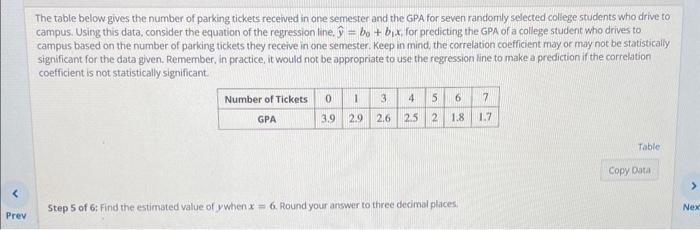
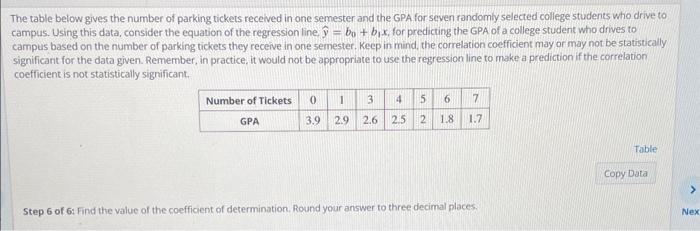
The table below gives the number of parking tickets received in one semester and the GPA for seven randomly selected college students who drive to campus. Using this data, consider the equation of the regression line, y^=b0+b1x, for predicting the GPA of a college student whio drives to campus based on the number of parking tickets they receive in one semester. Keep in mind, the correlation coefficient may or may not be statistically significant for the data given. Remember, in practice, it would not be appropriate to use the regression line to make a prediction if the correlation coefficient is not statistically significant. Step 1 of 6: Find the estimated slope. Round your answer to three decimal places. The table below gives the number of parking tickets received in one semester and the GPA for seven randomly selected college students who drive to campus. Using this data, consider the equation of the regression line, y^=b0+b1x, for predicting the GPA of a college student who drives to campus based on the number of parking tickets they receive in one semester. Keep in mind, the correlation coefficient may or may not be statisticaliy significant for the data given. Remember, in practice, it would not be appropriate to use the regression line to make a prediction if the correlation coefficient is not statistically significant. 5tep 2 of 6: Find the estimated yintercept, Round your answer to three decimal places. The table below gives the number of parking tickets received in one semester and the GPA for seven randomily selected college students who drive to campus. Using this data, consider the equation of the regression line, y^=b0+b1x, for predicting the GPA of a college student who drives to campus based on the number of parking tickets they receive in one semester. Keep in mind, the correlation coefficient may or may not be statistically significant for the data given. Remember, in practice, it would not be appropriate to use the regression line to make a prediction if the correlation coefficient is not statistically significant. 5tep 3 of 6: Substitute the values you found in steps 1 and 2 into the equation for the regression line to find the estimated linear model. According to this modet, if the value of the independent variable is increased by one unit, then find the change in the dependent variable y^. he table below gives the number of parking tickets received in one semester and the GPA for seven randomly selected college students who drive ampus. Using this data, consider the equation of the regression line y^=b0+b1x, for predicting the GPA of a college student who drives to campus based on the number of parking tickets they receive in one semester. Keep in mind, the correlation coefficient may or may not be statistica significant for the data given. Remember, in practice, it would not be appropriate to use the regression line to make a prediction if the correlation coefficient is not statistically significant. Step 4 of 6: Determine if the statement "Not all points predicted by the linear model fall on the same line" is true or false. The table below gives the number of parking tickets received in one semester and the GPA for seven randomly selected college students whio drive to campus. Using this data, consider the equation of the regression line, y^=b0+b1x, for predicting the GPA of a college student who drives to campus based on the number of parking tickets they receive in one semester. Keep in mind, the correlation coefficient may or may not be statistically significant for the data given. Remember. in practice, it would not be appropriate to use the regression line to make a prediction if the correlation coefficient is not statistically significant. Step 5 of 6 : Find the estimated value of y when x=6. Round your answer to three decimal places: The table below gives the number of parking tickets received in one semester and the GPA for seven randomly selected college students who drive to campus. Using this data, consider the equation of the regression line, y^=b0+b1x, for preclicting the GPA of a college student who drives to campus based on the number of parking tickets they receive in one semester. Keep in mind, the correlation coefficient may or may not be statistically significant for the data given. Remember, in practice, it would not be appropriate to use the regression line to make a prediction if the correlation coefficient is not statistically significant. Step 6 of 6: Find the value of the coefficient of determination. Round your answer to three decimal places
Step by Step Solution
There are 3 Steps involved in it

Get step-by-step solutions from verified subject matter experts