

Question: Help me out! Please answer the question 3e, 4e, 5b and 6d, THANK YOU! mean SALARY, over ( GENDER) Mean estimation Number of obs =
Help me out! Please answer the question 3e, 4e, 5b and 6d, THANK YOU!
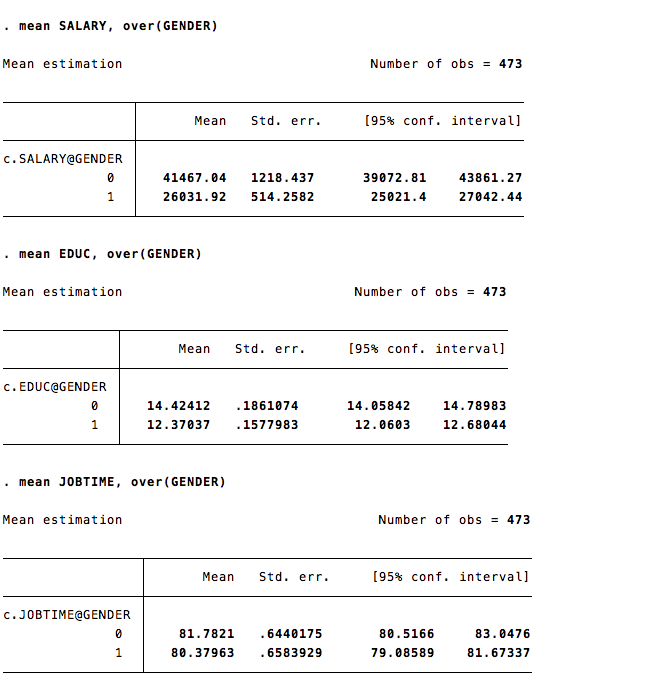
![= 473 Mean Std. err. [95% conf. interval] C. SALARY@GENDER 41467.04 1218.](https://dsd5zvtm8ll6.cloudfront.net/si.experts.images/questions/2024/11/672b687810ff8_040672b687801ffe.jpg)
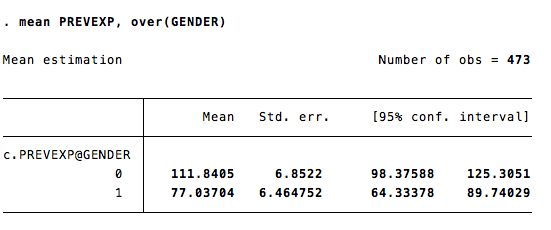
![= 473 Mean Std. err. [95% conf. interval] C. EDUC@GENDER 14. 42412](https://dsd5zvtm8ll6.cloudfront.net/si.experts.images/questions/2024/11/672b68791eddc_040672b6878eec7e.jpg)
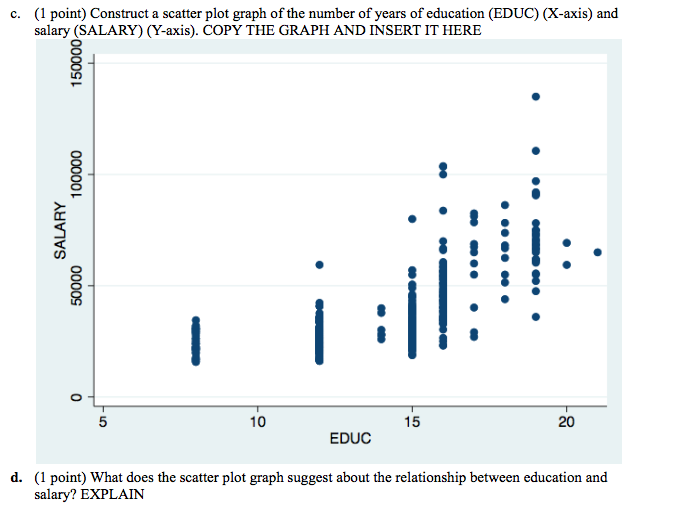
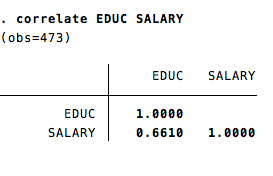
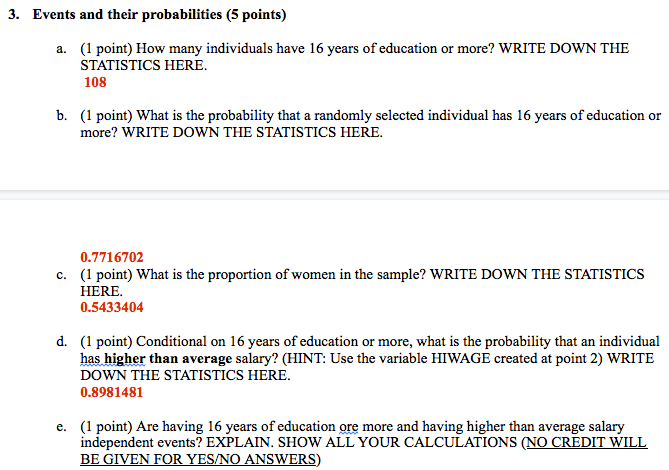
mean SALARY, over ( GENDER) Mean estimation Number of obs = 473 Mean Std. err. [95% conf. interval] C. SALARY@GENDER 41467.04 1218. 437 39072. 81 43861. 27 26031. 92 514. 2582 25021. 4 27042 . 44 mean EDUC, over ( GENDER) Mean estimation Number of obs = 473 Mean Std. err. [95% conf. interval] C. EDUC@GENDER 14. 42412 . 1861074 14. 05842 14. 78983 12. 37037 . 1577983 12. 0603 12. 68044 mean JOBTIME, over ( GENDER) Mean estimation Number of obs = 473 Mean Std. err. [95% conf. interval] C. JOBTIME@GENDER 81. 7821 . 6440175 80 . 5166 83. 0476 80. 37963 . 6583929 79. 08589 81. 67337mean PREVEXP, over ( GENDER) Mean estimation Number of obs = 473 Mean Std. err. [95% conf. interval] C. PREVEXPOGENDER 111 . 8405 6.8522 98.37588 125. 3051 77. 03704 6. 464752 64.33378 89. 740295. Correlation Coefficients (2 points) a. (1 point) Compute the correlation coefficient for number of years of education (EDUC) and salary (SALARY). WRITE DOWN THE STATISTICS HERE. 0.6610 b. (1 point) What does the correlation coefficient suggests? (COMMENT ON THE SIGN & STRENGTH, AND EXPLAIN THE IMPLIED RELATIONSHIP BETWEEN THE VARIABLES).correlate EDUC SALARY (obs=473) EDUC SALARY EDUC 1. 0000 SALARY 0 . 6610 1. 00003. Events and their probabilities (5 points) a. (1 point) How many individuals have 16 years of education or more? WRITE DOWN THE STATISTICS HERE. 108 b. (1 point) What is the probability that a randomly selected individual has 16 years of education or more? WRITE DOWN THE STATISTICS HERE. 0.7716702 c. (1 point) What is the proportion of women in the sample? WRITE DOWN THE STATISTICS HERE. 0.5433404 d. (1 point) Conditional on 16 years of education or more, what is the probability that an individual has higher than average salary? (HINT: Use the variable HIWAGE created at point 2) WRITE DOWN THE STATISTICS HERE. 0.8981481 e. (1 point) Are having 16 years of education ore more and having higher than average salary independent events? EXPLAIN. SHOW ALL YOUR CALCULATIONS (NO CREDIT WILL BE GIVEN FOR YES/NO ANSWERS)4. Comparison of means (5 points) a. (1 point) Compute the average salary (SALARY) for men and the average salary for women. WRITE DOWN THE RESULT HERE Women 41467.04 Men 26031.92 b. (1 point) Compute the average number of years of education (EDUC) for men and the average number of years of education for women. WRITE DOWN THE RESULT HERE Women 14.42412 Men 12.37037 c. (1 point) Compute the average number of months with the company (JOBTIME) for men and the average number of months with the company for women. WRITE DOWN THE RESULT HERE Women 81.7821 Men 80.37963 d. (1 point) Compute the average number of months of previous experience (PREVEXP) for men and the average number of months of previous experience (PREVEXP) for women. WRITE DOWN THE RESULT HERE Women 111.8405 Men 77.03704 e. 1 point) Summarize your findings at points a-d. Answer the following questions: (1) Are there any gender wage differentials? (2) Could the gender wage differentials be explained, in part, by differences in other personal characteristics? EXPLAIN YOUR ANSWER. (NO CREDIT WILL BE GIVEN FOR YES/NO ANSWERS)c. (1 point) Construct a scatter plot graph of the number of years of education (EDUC) (X-axis) and salary (SALARY) (Y-axis). COPY THE GRAPH AND INSERT IT HERE 150000 100000 .. SALARY 50000 O 10 15 20 EDUC d. (1 point) What does the scatter plot graph suggest about the relationship between education and salary? EXPLAIN
Step by Step Solution
There are 3 Steps involved in it

Get step-by-step solutions from verified subject matter experts