

Question: Help me please Example 1: the table below shows the scores in Grade 9 Mathematics of 70 students. Scores Class Boundaries Less Than Cumulative Frequency
Help me please
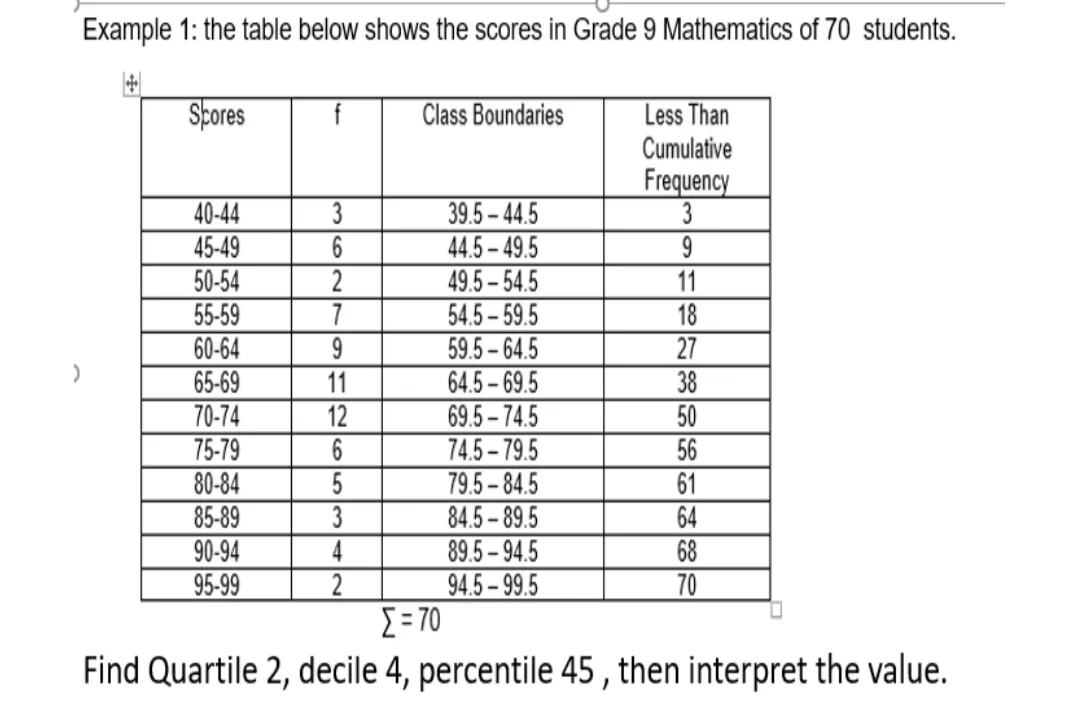
Example 1: the table below shows the scores in Grade 9 Mathematics of 70 students. Scores Class Boundaries Less Than Cumulative Frequency 40-44 39.5 - 44.5 3 45-49 44.5 - 49.5 CO 50-54 -NO 49.5 -54.5 11 55-59 54.5-59.5 18 60-64 9 59.5- 64.5 27 65-69 11 64.5 -69.5 38 70-74 12 69.5 - 74.5 50 75-79 74.5- 79.5 56 80-84 5 79.5 - 84.5 61 85-89 w 84.5 - 89.5 64 90-94 89.5 - 94.5 68 N A 95-99 94.5 - 99.5 70 [=70 Find Quartile 2, decile 4, percentile 45 , then interpret the value
Step by Step Solution
There are 3 Steps involved in it
1 Expert Approved Answer
Step: 1 Unlock

Question Has Been Solved by an Expert!
Get step-by-step solutions from verified subject matter experts
Step: 2 Unlock
Step: 3 Unlock