

Question: help me revise number 3 The following data represent the amount of money an investor has in an investment account each year for 10 years.
help me revise number 3
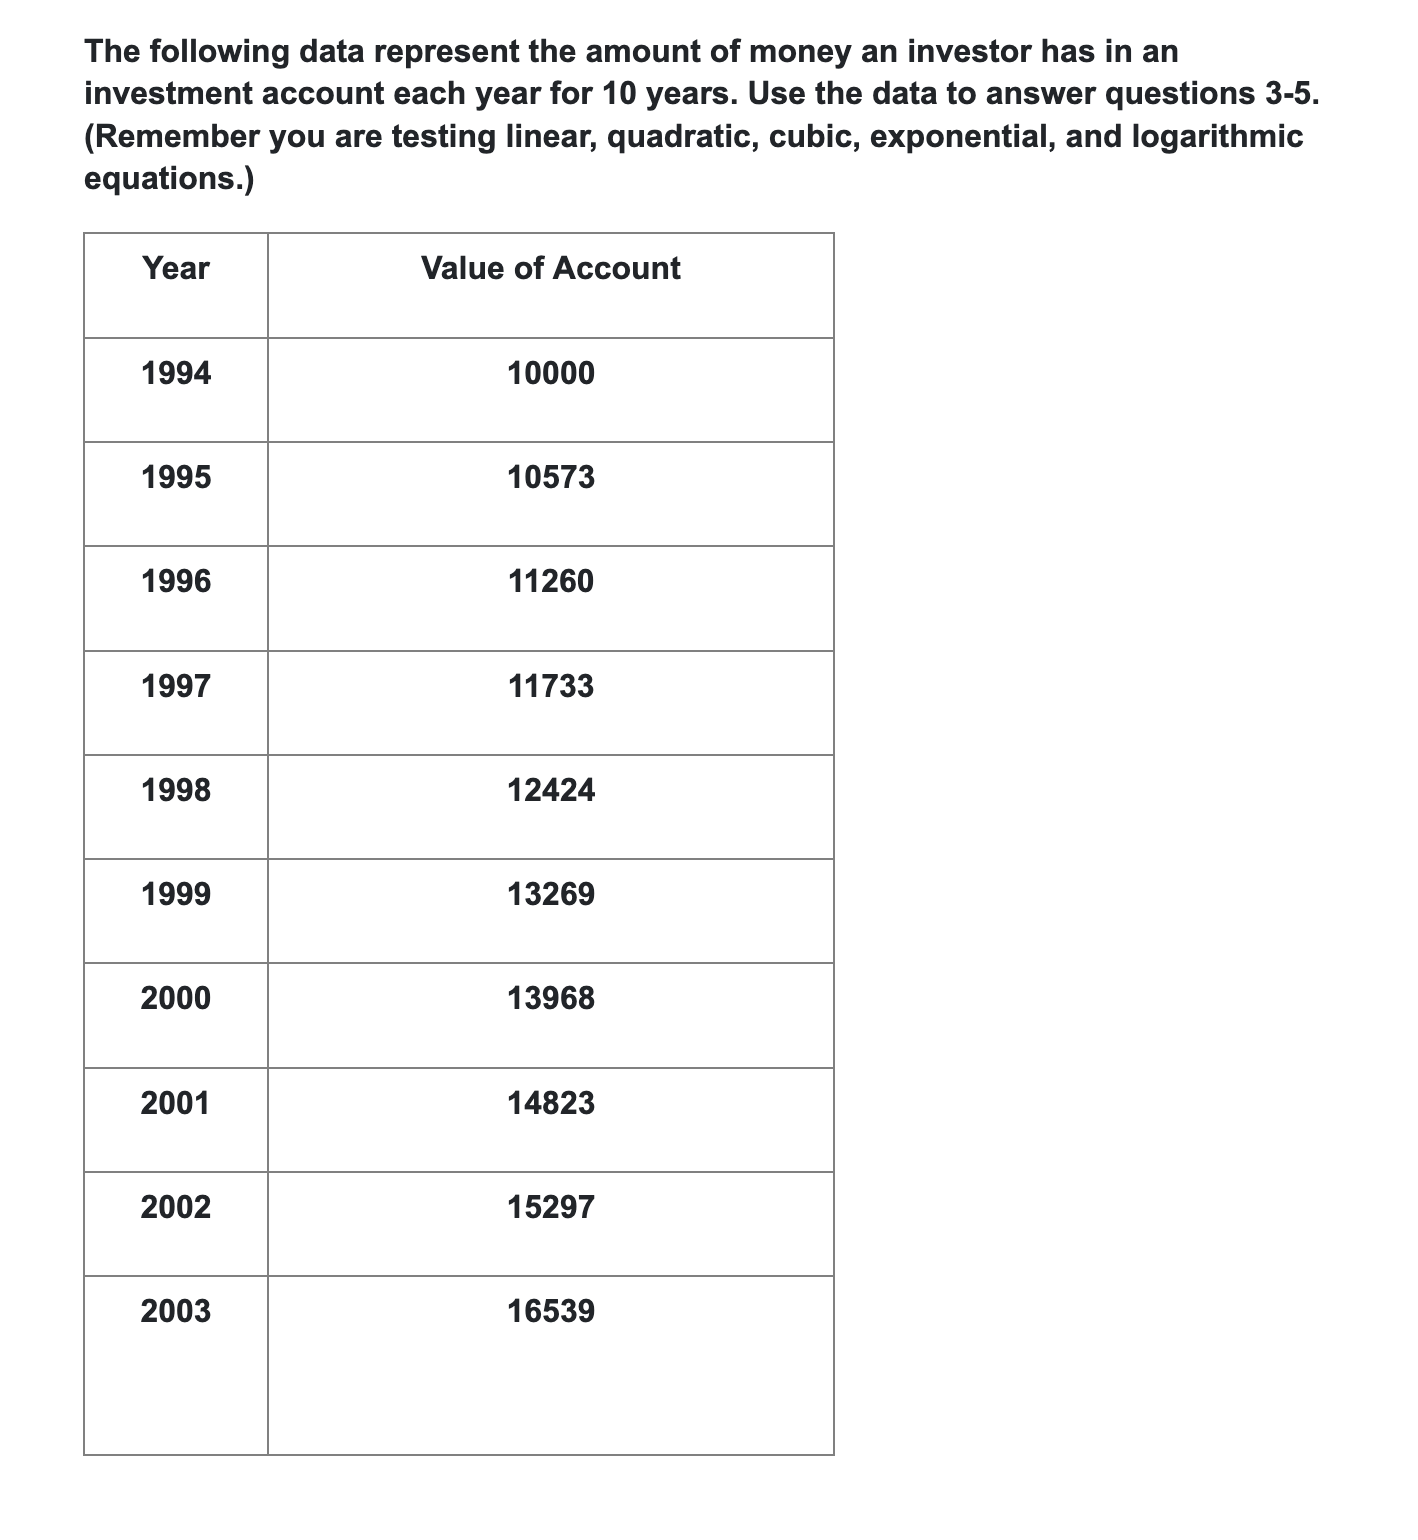
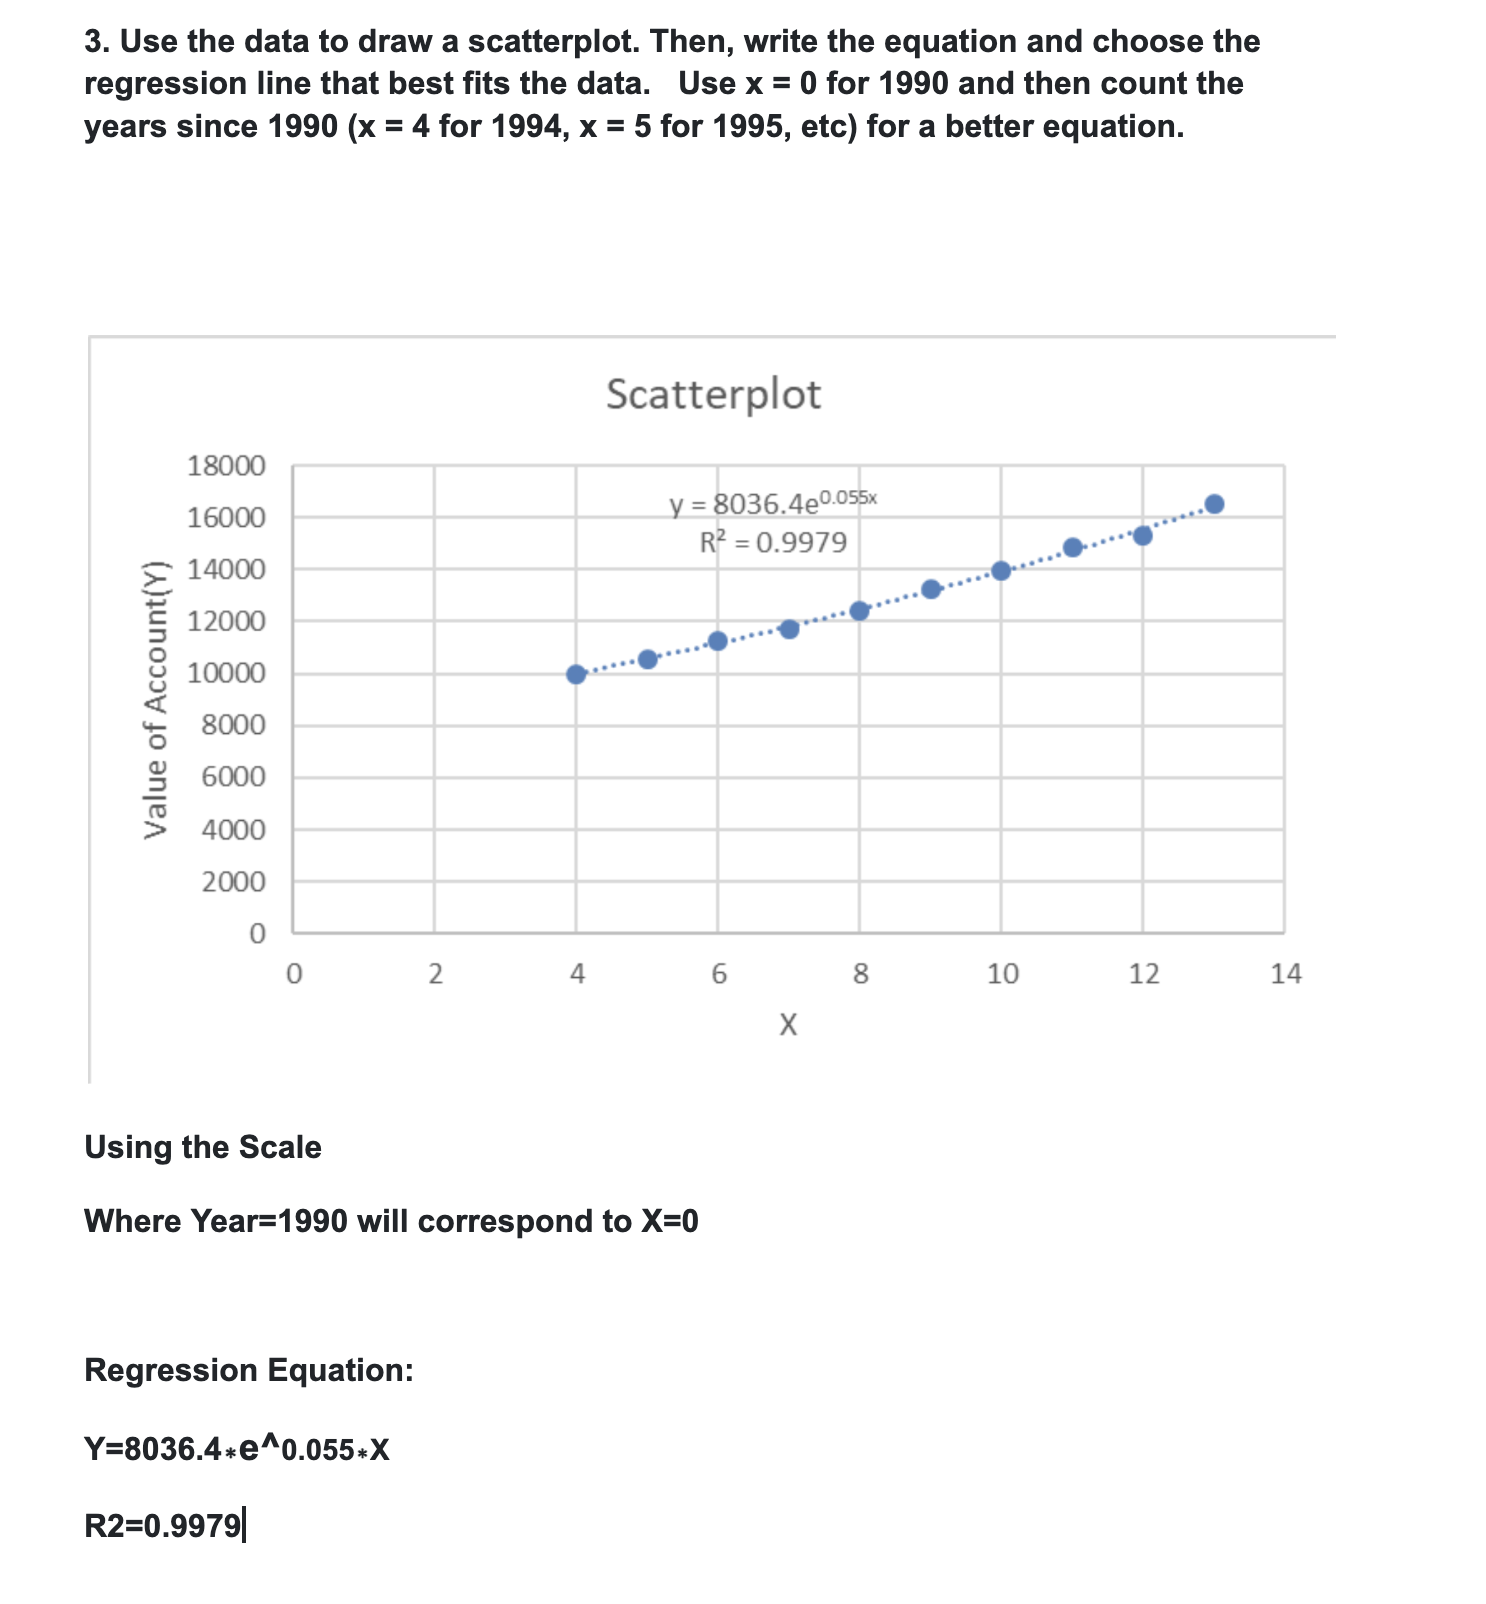
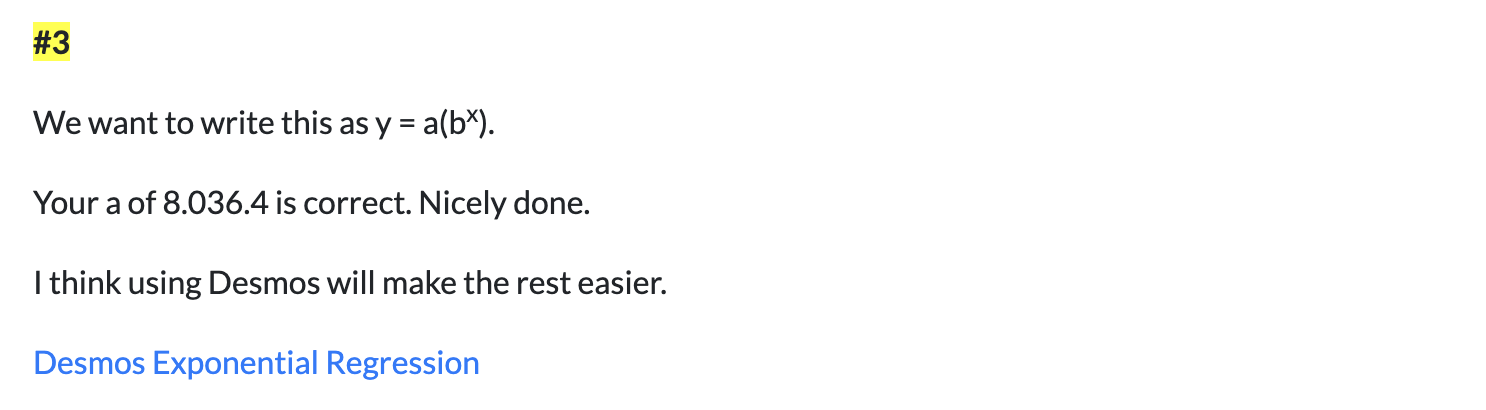
The following data represent the amount of money an investor has in an investment account each year for 10 years. Use the data to answer questions 3-5. (Remember you are testing linear, quadratic, cubic, exponential, and logarithmic equations.) Value of Account 1994 10000 1997 11733 3. Use the data to draw a scatterplot. Then, write the equation and choose the regression line that best fits the data. Use x = 0 for 1990 and then count the years since 1990 (x = 4 for 1994, x = 5 for 1995, etc) for a better equation. Scatterplot 16000 y = 8036.4e005 . R? =0.9979 e 12000 ..- Value of Account(Y) Using the Scale Where Year=1990 will correspond to X=0 Regression Equation: Y=8036.4+"0.055:X R2=0.9979| #3 We want to write this as y = a(b). Your a of 8.036.4 is correct. Nicely done. | think using Desmos will make the rest easier. Desmos Exponential Regression
Step by Step Solution
There are 3 Steps involved in it
To revise the answer for question 3 follow these steps for clarity and correctness Step 1 Organize D... View full answer

Get step-by-step solutions from verified subject matter experts