

Question: Help me solve this problem? Explain how you did it? The Excel frequency bar graph below describes the employment status of a random sample of
Help me solve this problem? Explain how you did it?
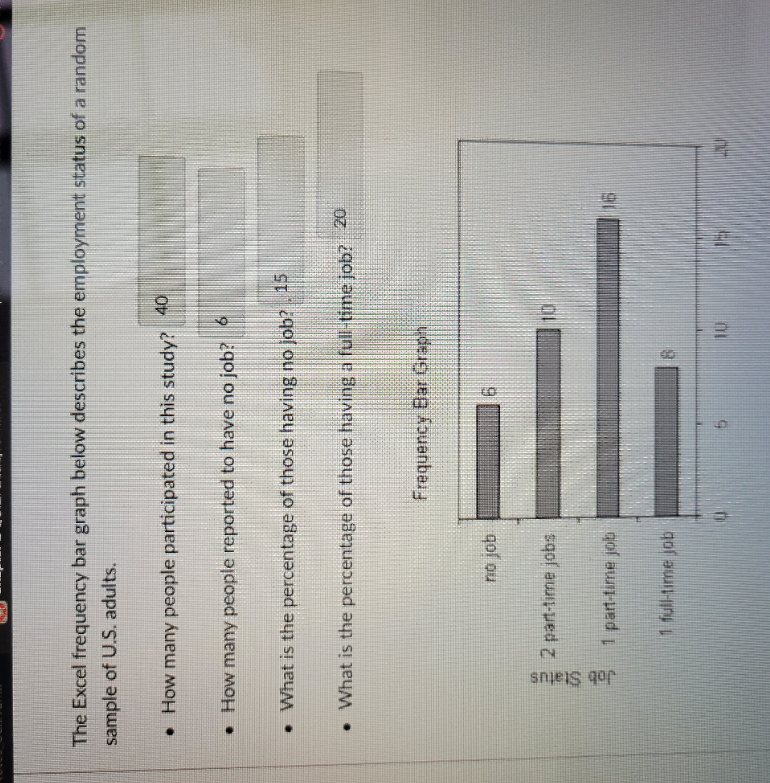
The Excel frequency bar graph below describes the employment status of a random sample of U.S. adults. . How many people participated in this study? 40 . How many people reported to have no job? . What is the percentage of those having no job? . 15 . What is the percentage of those having a full-time job? 20 Frequency Bar Graph no job 2 part-time jobs Job Status 1 part-time job 1 full-time job
Step by Step Solution
There are 3 Steps involved in it
1 Expert Approved Answer
Step: 1 Unlock

Question Has Been Solved by an Expert!
Get step-by-step solutions from verified subject matter experts
Step: 2 Unlock
Step: 3 Unlock