

Question: Help me solve this problem in a code in matlab, I just need the solution for problems in black. I NEED THE SOLUTION IN MATLAB
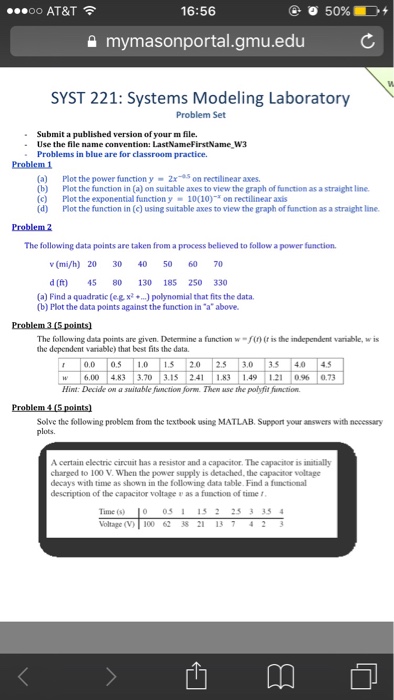
50% D oo AT&T 16:56 my mason portal gmu.edu C SYST 221: Systems Modeling Laboratory Problem Set Submit a published versi on of your m file. Use the file name conven on: LastNameFirstName W3 n blue are for classroom practice. (a) Plot the power function y 2x on rectilinear axes. (b) Plot the function in (a) on suitable axes to view the graph offunction as a straight line. (c) Plot the exponential function y 10(10) on rectilinear axis (d) Plot the function in (c) using suitable axesto view the graph offunction as a straight line. The following data points are taken from a process believed to follow a power function. v (mi/h) 20 d(ft) 80 130 185 250 (a) Find a quadratic (eg x polynomial that fits the data. (b) Plot the data points against the function in above. The following data points are given. Determine a function w f()(r is the independent variable, w is the dependent variable) that best fits the data. r 00 0.5 10 1,5 20 25 30 35 40 45 w 6.00 4.83 3,70 3.15 2,41 183 1,49 121 096 073 Hint: Decide on a suitable finction form. Then ause the politit finction. Solve the following problem from the textbook using MATLAB. Support your answers with necessary A certain electric circuit has a resistor and a capacitor, The capacitoris initially charged to 100 V When the power supply is detached, the capacitor voltage decays with time as shown in the following data table. Find a functional description of the capacitor voltage as a function of time 05 25 3 35 4 Voltage m
Step by Step Solution
There are 3 Steps involved in it

Get step-by-step solutions from verified subject matter experts