

Question: help me to perform a five-way analysis of return on equity (ROE) for exhibit 6? Below is the exhibit that I got from the case
help me to perform a five-way analysis of return on equity (ROE) for exhibit 6?
Below is the exhibit that I got from the case study:
Ratio Table:
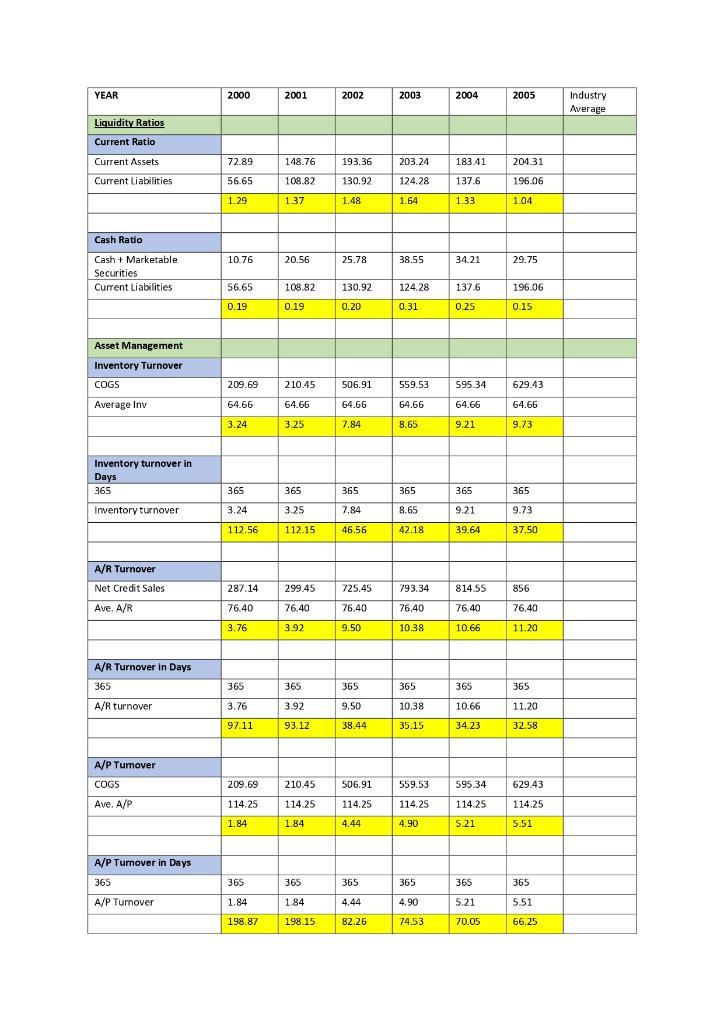
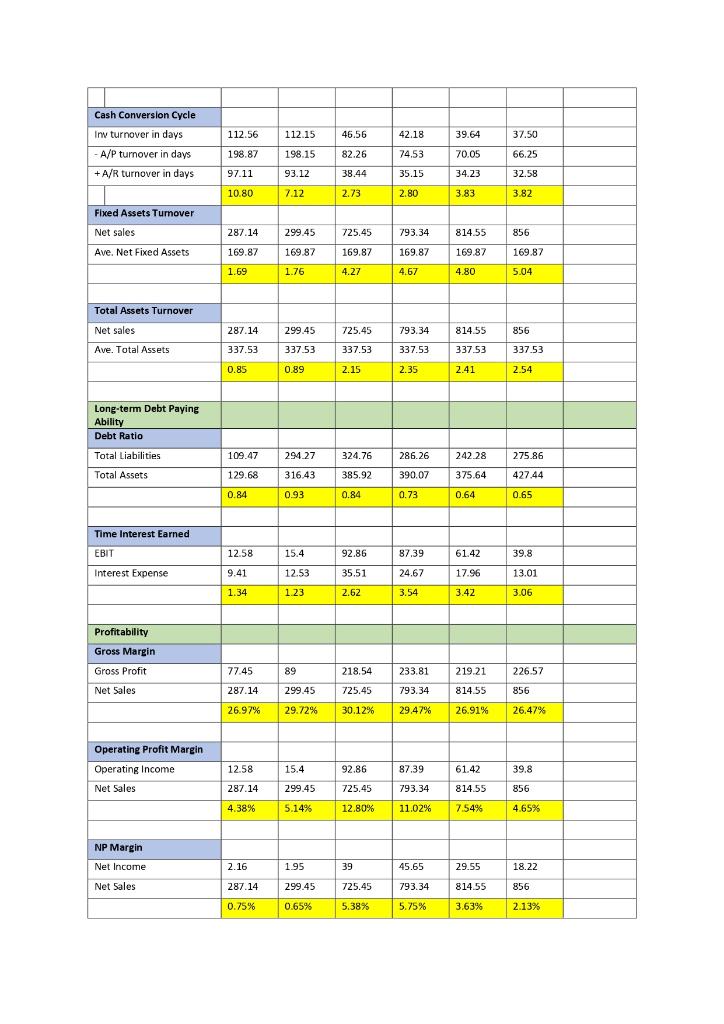
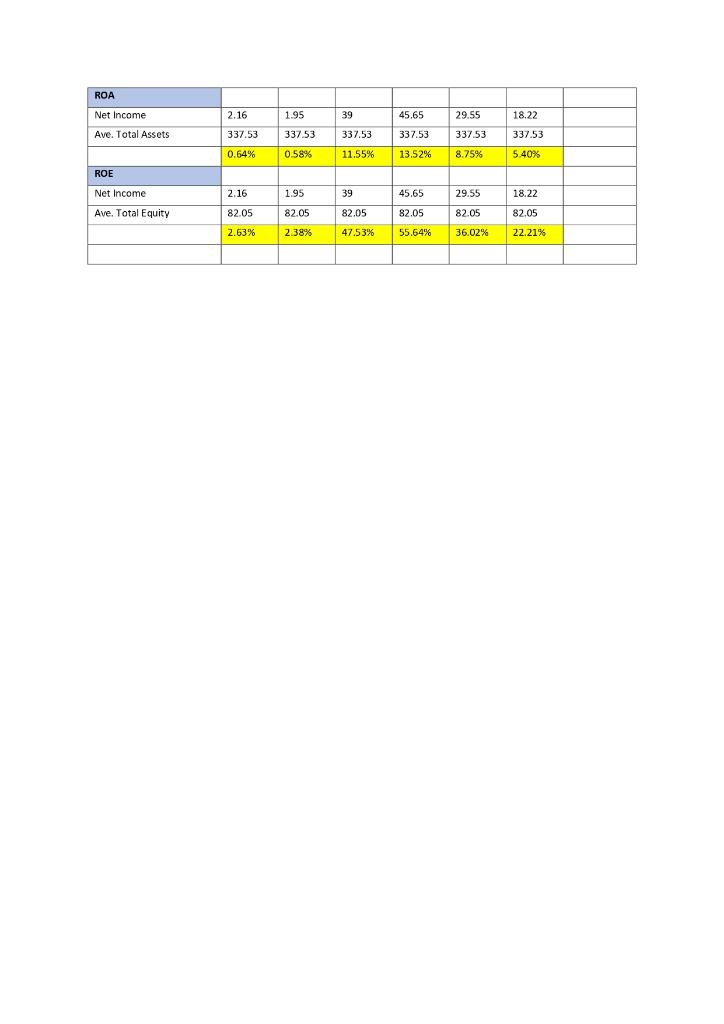
Exhibit 6 that I need help with :
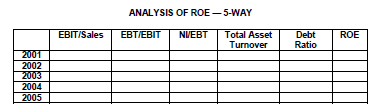
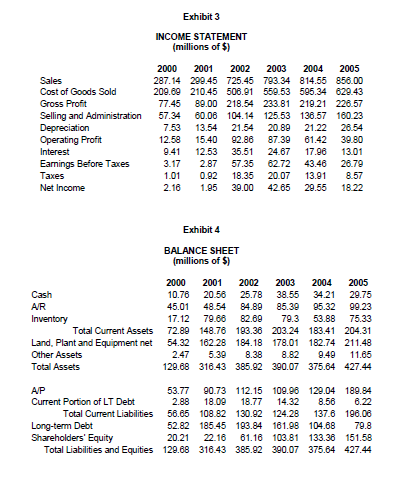
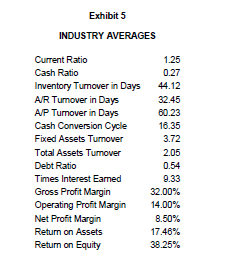
Exhibit 3 INCOME STATEMENT (millions of $) Sales Cost of Goods Sold Gross Profit Selling and Administration Depreciation Operating Profit Interest Earnings Before Taxes Taxes Net Income 2000 2001 2002 2003 2004 2005 287.14 299.45 725.45 793.34 814.55 856.00 209.69 210.45 506.91 550.53 596.34 620.43 77.45 89.00 218.54 233.81 219.21 226.57 57.34 60.06 104.14 125.53 136.57 160.23 7.53 13.54 21.54 20.89 21.22 26.54 12.58 15.40 92.86 87.39 61.42 39.80 9.41 12.53 35.51 24.67 17.96 13.01 3.17 2.87 57.35 62.72 43.48 26.79 1.01 0.92 18.35 20.07 13.91 8.57 2.16 1.95 39.00 42.65 29 55 18 22 Exhibit 4 BALANCE SHEET (millions of $) Cash AR Inventory Total Current Assets Land, Plant and Equipment net Other Assets Total Assets 2000 2001 2002 2003 2004 2005 10.76 20.56 25.78 38.55 34.21 29.75 45.01 48.54 84.89 85.39 95.32 99.23 17.12 79.66 82.69 79.3 53.88 75.33 72.89 148.76 193.36 203.24 183.41 204.31 54.32 162.28 184.18 178.01 182.74 211.48 2.47 5.39 8.38 8.82 9.49 11.65 129.68 316.43 385.92 390.07 375.84 427.44 AP 53.77 90.73 112.15 109.96 129.04 189.84 Current Portion of LT Debt 2.88 18.00 18.77 14.32 8.56 6.22 Total Current Liabilities 56.65 108.82 130.92 124.28 137.6 190.00 Long-term Debt 52.82 185.45 193.84 161.98 104.68 79.8 Shareholders' Equity 20.21 22.16 61.16 103.81 133.36 151.58 Total Liabilities and Equities 129.68 316.43 385.92 390.07 375.64 427.44 Exhibit 5 INDUSTRY AVERAGES Current Ratio Cash Ratio Inventory Turnover in Days A/R Turnover in Days AJP Turnover in Days Cash Conversion Cycle Fixed Assets Tumover Total Assets Tumover Debt Ratio Times Interest Earned Gross Profit Margin Operating Profit Margin Net Profit Margin Return on Assets Return on Equity 1.25 0.27 44.12 32.45 60.23 16.35 3.72 2.05 0.54 9.33 32.00% 14.00% 8.50% 17.46% 38.25% % YEAR 2000 2001 2002 2003 2004 2005 Industry Average Liquidity Ratios Current Ratio Current Assets 72.89 193.36 183.41 204.31 148.76 108.82 203.24 124.28 Current Liabilities 56.65 130.92 137.6 196.06 1.29 137 1.48 1.64 1.33 1.04 Cash Ratio 10.76 20.56 25.78 38.55 34.21 29.75 Cash + Marketable Securities Current Liabilities 56.65 108.82 130.92 124.28 1376 196.06 0.15 0.19 0.19 0.20 0.31 0.25 Asset Management Inventory Turnover COGS 209.69 210.45 506.91 559.53 595.34 629.43 Average Inv 64.66 64.66 64.66 64.66 64.66 64.66 9.21 3.24 3.25 7.84 8.65 9.73 Inventory turnover in Days 365 365 365 365 365 365 365 Inwentory turnover 3.24 3.25 7.84 8.65 9.21 9.73 112.56 112.15 46.56 42.18 39.64 37.50 A/R Turnover Net Credit Sales Ave. A/R 287.14 299.45 793 34 856 725.45 76.40 814.55 76.40 76.40 76.40 76.40 76.40 3.76 3.92 9.50 10.38 10.66 11.20 A/R Turnover in Days 365 365 365 365 365 365 365 A A/R turnover 3.76 3.92 9.50 10.38 10.66 11.20 97.11 93.12 38.44 35.15 34.23 32.58 A/P Turnover COGS 209.69 210.45 506.91 559.53 595.34 629.43 Ave. A/P A 114.25 114.25 114.25 114.25 114.25 114.25 1.84 1.84 4.44 4.90 5.21 5.51 A/P Turnover in Days 365 365 365 365 365 365 365 A/P Turnover 1.84 1.84 4.44 4.90 5.21 5.51 198.87 198.15 82.26 74.53 70.05 66.25 Cash Conversion Cycle 112.56 112.15 46.56 42.18 39.64 37.50 Inv turnover in days - P - A/P turnover in days + A/R turnover in days 198.87 198.15 82.26 74.53 70.05 66.25 97.11 93.12 38.44 35.15 34.23 32.58 10.80 7.12 2.73 2.80 3.83 3.82 Fixed Assets Tumover 299.45 793.34 814.55 856 Net sales Ave. Net Fixed Assets 287.14 169.87 725.45 169.87 169.87 169.87 169.87 16987 1.69 1.76 4.27 4.67 4.80 5.04 Total Assets Turnover Net sales 287.14 725.45 793.34 814.55 856 299.45 33753 Ave. Total Assets 337.53 337.53 337.53 337.53 337.53 0.85 0.89 2.15 2.35 2.41 2.54 Long-term Debt Paying Ability Debt Ratio Total Liabilities 109.47 294.27 324.76 286.26 242.28 275.86 Total Assets 129.68 316.43 385.92 390.07 375.64 427.44 0.84 0.93 0.84 0.73 0.64 0.65 Time Interest Earned EBIT 12.58 15.4 92.86 87.39 61.42 39.8 Interest Expense 9.41 35.51 24.67 17.96 12.53 1.23 13.01 3.06 1.34 2.62 3.54 3.42 Profitability Gross Margin Gross Profit 77.45 89 218.54 233.81 219.21 226.57 Net Sales 287.14 299.45 725.45 793.34 814.55 856 26.97% 29.72% 30.12% 29.47% 26.91% 26.47% Operating Profit Margin Operating Income Net Sales 12.58 15.4 92.86 87.39 61.42 39.8 287.14 299.45 725.45 793.34 814.55 856 4.38% 5.14% 12.80% 11.02% 7.54% 4.65% NP Margin Net Income 2.16 1.95 39 45.65 29.55 18.22 Net Sales 287.14 299.45 725.45 793.34 814.55 856 0.75% 0.65% 5.38% 5.75% 3.63% 2.13% ROA 2.16 1.95 39 45,65 29.55 Net Income Ave. Total Assets 18.22 33753 337.53 33753 337.53 337.53 33753 0.64% 0.58% 11.55% 13.52% 8.75% 5.40% % ROE Net Income 2.16 1.95 39 18.22 45.65 82.05 29.55 82.05 Ave. Total Equity 82.05 82.05 82.05 82.05 2.63% 2.38% 47.53% 55.64% 36.02% 22.21% ANALYSIS OF ROE - 5-WAY EBIT/Sales EBT/EBIT NIEBT Total Asset Turnover Debt Ratio ROE 2001 2002 2003 2004 2005
Step by Step Solution
There are 3 Steps involved in it

Get step-by-step solutions from verified subject matter experts