

Question: Help me to solve maximum questions. I will up-vote you forever Refer to the attached financial statements then compute the following: 5. A/R Turnover: 6.
Help me to solve maximum questions. I will up-vote you forever

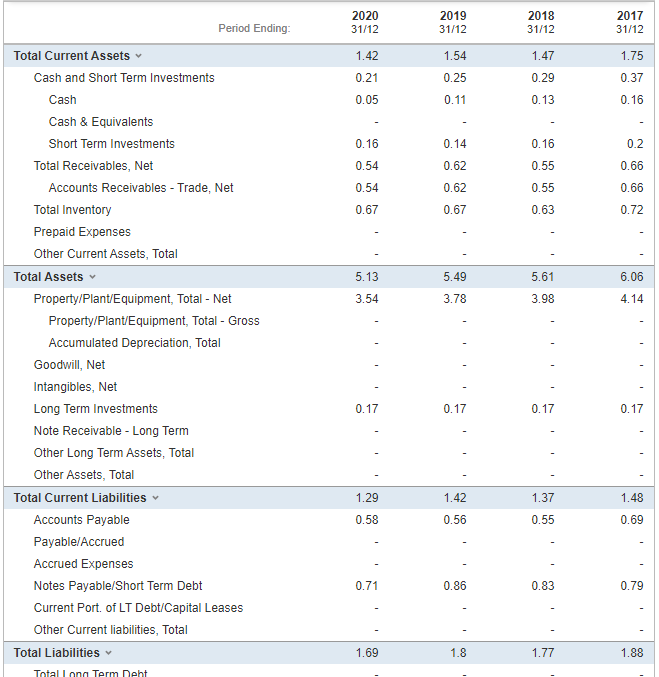
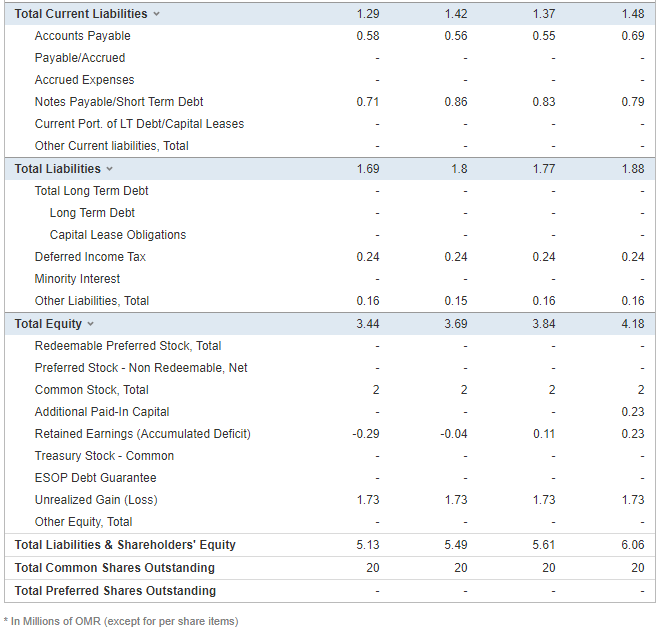
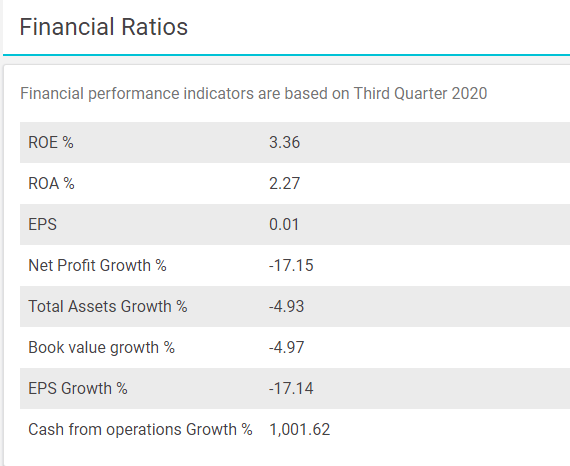
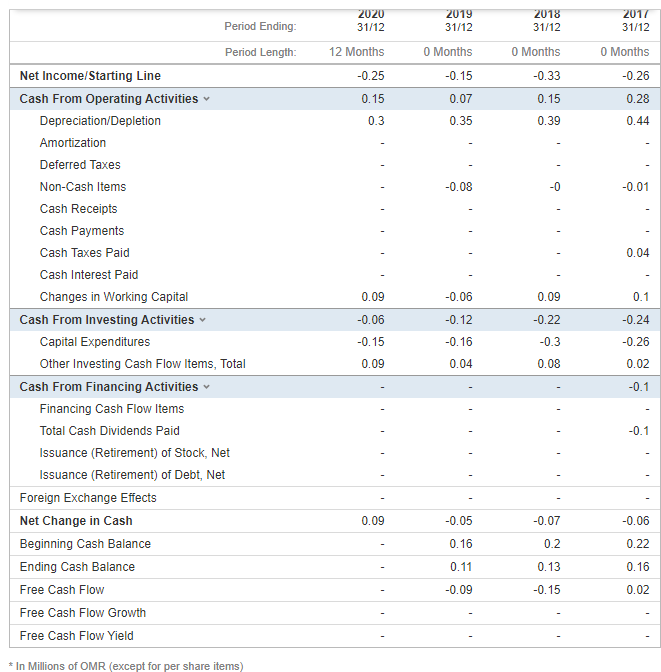
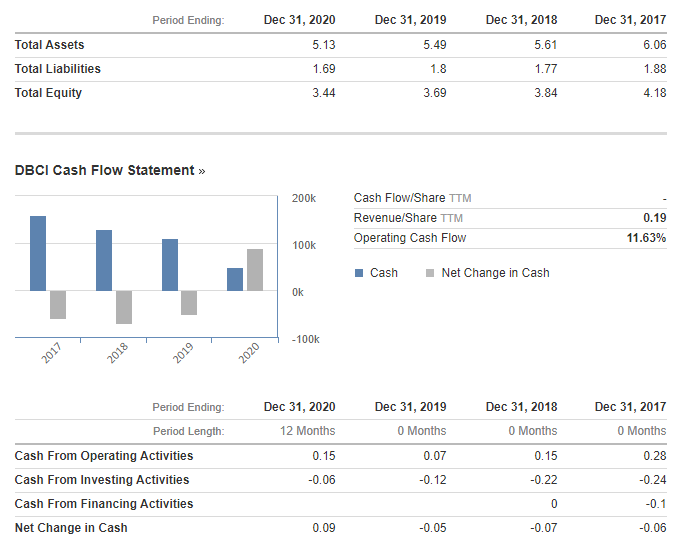
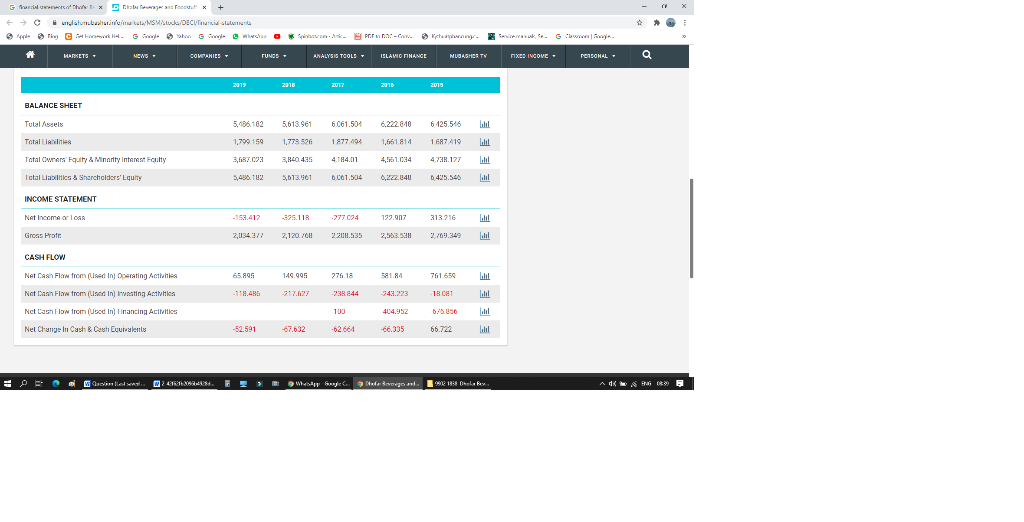
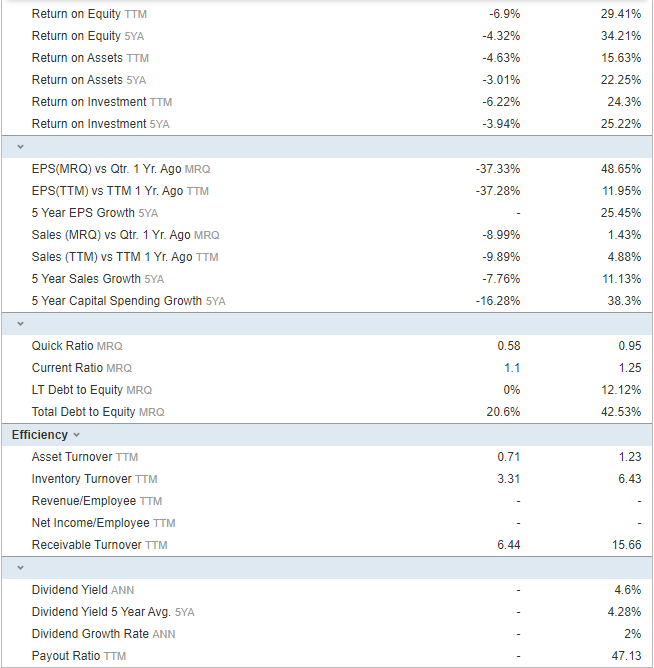
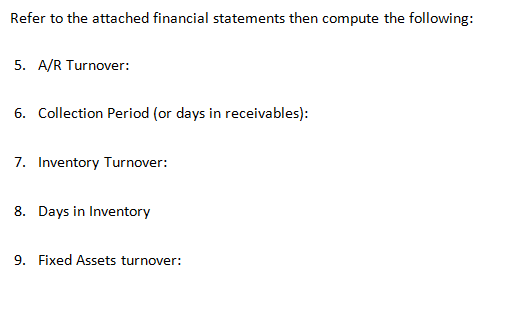
Refer to the attached financial statements then compute the following: 5. A/R Turnover: 6. Collection Period (or days in receivables): 7. Inventory Turnover: 8. Days in Inventory 9. Fixed Assets turnover: The report should discuss the following topics: 2020 31/12 2019 31/12 2018 31/12 2017 31/12 1.42 1.54 1.75 1.47 0.29 0.21 0.25 0.37 0.05 0.11 0.13 0.16 0.14 0.2 0.16 0.54 0.16 0.55 0.55 0.62 0.62 0.66 0.54 0.66 0.67 0.67 0.63 0.72 5.49 6.06 5.13 3.54 5.61 3.98 3.78 4.14 Period Ending: Total Current Assets Cash and Short Term Investments Cash Cash & Equivalents Short Term Investments Total Receivables, Net Accounts Receivables - Trade, Net Total Inventory Prepaid Expenses Other Current Assets, Total Total Assets Property/Plant/Equipment, Total - Net Property/Plant/Equipment, Total - Gross Accumulated Depreciation, Total Goodwill, Net Intangibles, Net Long Term Investments Note Receivable - Long Term Other Long Term Assets, Total Other Assets, Total Total Current Liabilities Accounts Payable Payable/Accrued Accrued Expenses Notes Payable/Short Term Debt Current Port of LT Debt/Capital Leases Other Current liabilities, Total Total Liabilities 0.17 0.17 0.17 0.17 1.29 1.42 1.37 1.48 0.58 0.56 0.55 0.69 0.71 0.86 0.83 0.79 1.69 1.8 1.77 1.88 Total Long Term Deht 1.29 1.42 1.37 1.48 0.58 0.56 0.55 0.69 0.71 0.86 0.83 0.79 1.69 1.8 1.77 1.88 0.24 0.24 0.24 0.24 Total Current Liabilities Accounts Payable Payable/Accrued Accrued Expenses Notes Payable/Short Term Debt Current Port of LT Debt/Capital Leases Other Current liabilities, Total Total Liabilities Total Long Term Debt Long Term Debt Capital Lease Obligations Deferred Income Tax Minority Interest Other Liabilities, Total Total Equity Redeemable Preferred Stock, Total Preferred Stock - Non Redeemable, Net Common Stock, Total Additional Paid-In Capital Retained Earnings (Accumulated Deficit) Treasury Stock - Common ESOP Debt Guarantee Unrealized Gain (Loss) Other Equity, Total Total Liabilities & Shareholders' Equity Total Common Shares Outstanding Total Preferred Shares Outstanding 0.16 0.15 0.16 0.16 3.44 3.69 3.84 4.18 2 2 2 2 0.23 -0.29 -0.04 0.11 0.23 1.73 1.73 1.73 1.73 5.13 5.49 5.61 6.06 20 20 20 20 * In Millions of OMR (except for per share items) Financial Ratios Financial performance indicators are based on Third Quarter 2020 ROE % 3.36 ROA % 2.27 EPS 0.01 Net Profit Growth % -17.15 Total Assets Growth % -4.93 Book value growth % -4.97 EPS Growth % -17.14 Cash from operations Growth % 1,001.62 Period Ending: 2020 31/12 2019 31/12 2018 31/12 2017 31/12 12 Months O Months 0 Months 0 Months -0.15 -0.33 -0.26 -0.25 0.15 0.3 0.07 0.28 0.15 0.39 0.35 0.44 -0.08 -0 -0.01 0.04 0.09 -0.06 0.09 0.1 -0.06 -0.22 Period Length: Net Income/Starting Line Cash From Operating Activities Depreciation/Depletion Amortization Deferred Taxes Non-Cash Items Cash Receipts Cash Payments Cash Taxes Paid Cash Interest Paid Changes in Working Capital Cash From Investing Activities Capital Expenditures Other Investing Cash Flow Items, Total Cash From Financing Activities Financing Cash Flow Items Total Cash Dividends Paid Issuance (Retirement) of Stock, Net Issuance (Retirement) of Debt, Net Foreign Exchange Effects Net Change in Cash Beginning Cash Balance Ending Cash Balance Free Cash Flow Free Cash Flow Growth Free Cash Flow Yield -0.12 -0.16 -0.24 -0.26 -0.15 -0.3 0.09 0.04 0.08 0.02 -0.1 -0.1 - - 0.09 -0.05 -0.07 -0.06 0.16 0.2 0.22 0.11 0.13 0.16 -0.09 -0.15 0.02 * In Millions of OMR (except for per share items) Period Ending: Dec 31, 2020 Dec 31, 2019 Dec 31, 2017 Dec 31, 2018 5.61 5.13 5.49 6.06 Total Assets Total Liabilities Total Equity 1.69 1.8 1.77 1.88 3.44 3.69 3.84 4.18 DBCI Cash Flow Statement >> 200k Cash Flow/Share TTM Revenue/Share ITM Operating Cash Flow 0.19 11.63% 100K Cash Net Change in Cash OK -100k 2017 2018 2019 2020 Dec 31, 2020 12 Months Dec 31, 2019 O Months Dec 31, 2018 O Months Dec 31, 2017 O Months 0.15 0.07 0.15 0.28 Period Ending: Period Length: Cash From Operating Activities Cash From Investing Activities Cash From Financing Activities Net Change in Cash -0.06 -0.12 -0.22 -0.24 0 -0.1 0.09 -0.05 -0.07 -0.06 G H x Bags Foot' x + na watumbasim bel/MISWA/DECUTIKSLAS C. Gw We G Wherche .. Gavek se G C MARKETS NEWS. COMPANIES FUNDS. ANALYSIS TOOLS - ISLAVIO FINANCE NLEASHES TU XED INCOVE. PERSONAL O 2019 2015 2017 205 BALANCE SHEET Tulal Assels 5,106,182 5,613.961 6.061.504 6.222.840 6:125.546 Total 1,799.159 1,779 526 1877.404 1,661.814 1 687 419 3,840.435 4.184.01 4.738.177 Total Owners' Equity & Minority interest Faulty Total Liabilities & Sharcholders' Equity 5,455102 5,613.561 0.001.504 425.54 INCOME STATEMENT Not Income or los -158.412 -325.118 -277024 173.007 313916 Gross Pratr 2,120.7011 2208.535 2,563.3 CASH FLOW NAT Cash Flow from(used in Oberating Activiti 65995 149.995 276 18 581.84 761 656 LA - 118.45 238 844 243.223 1801 lil Net Dash Flow from (Used In Investing Activities Net Cashion from (Used In) Financing Activities Nel Change In Cash & Cast Equivalents 100 404.952 5/5.250 52.591 -67.632 -62664 -66.335 66.722 W > Way Sweden. 1838 Dela Bex -6.9% -4.32% 29.41% 34.21% 15.63% Return on Equity TTM Return on Equity 5YA Return on Assets ITM Return on Assets SYA Return on Investment TTM Return on Investment 5YA -4.63% -3.01% 22.25% -6.22% 24.3% -3.94% 25.22% -37.33% 48.65% -37.28% 11.95% 25.45% EPS(MRO) vs Qtr. 1 Yr. Ago MRQ EPS(TTM) vs TTM 1 Yr. Ago TTM 5 Year EPS Growth SYA Sales (MRO) vs Qtr. 1 Yr. Ago MRQ Sales (TTM) vs TTM 1 Yr. Ago TTM 5 Year Sales Growth SYA 5 Year Capital Spending Growth SYA -8.99% 1.43% -9.89% 4.88% -7.76% 11.13% -16.28% 38.3% 0.58 0.95 1.1 1.25 0% 12.12% 20.6% 42.53% Quick Ratio MRQ Current Ratio MRO LT Debt to Equity MRQ Total Debt to Equity MRQ Efficiency Asset Turnover TTM Inventory Turnover TTM Revenue/Employee TTM Net Income/Employee TTM Receivable Turnover TTM 0.71 1.23 3.31 6.43 6.44 15.66 4.6% 4.28% Dividend Yield ANN Dividend Yield 5 Year Avg. SYA Dividend Growth Rate ANN Payout Ratio TTM 2% 47.13 Refer to the attached financial statements then compute the following: 5. A/R Turnover: 6. Collection Period (or days in receivables): 7. Inventory Turnover: 8. Days in Inventory 9. Fixed Assets turnover: The report should discuss the following topics: 2020 31/12 2019 31/12 2018 31/12 2017 31/12 1.42 1.54 1.75 1.47 0.29 0.21 0.25 0.37 0.05 0.11 0.13 0.16 0.14 0.2 0.16 0.54 0.16 0.55 0.55 0.62 0.62 0.66 0.54 0.66 0.67 0.67 0.63 0.72 5.49 6.06 5.13 3.54 5.61 3.98 3.78 4.14 Period Ending: Total Current Assets Cash and Short Term Investments Cash Cash & Equivalents Short Term Investments Total Receivables, Net Accounts Receivables - Trade, Net Total Inventory Prepaid Expenses Other Current Assets, Total Total Assets Property/Plant/Equipment, Total - Net Property/Plant/Equipment, Total - Gross Accumulated Depreciation, Total Goodwill, Net Intangibles, Net Long Term Investments Note Receivable - Long Term Other Long Term Assets, Total Other Assets, Total Total Current Liabilities Accounts Payable Payable/Accrued Accrued Expenses Notes Payable/Short Term Debt Current Port of LT Debt/Capital Leases Other Current liabilities, Total Total Liabilities 0.17 0.17 0.17 0.17 1.29 1.42 1.37 1.48 0.58 0.56 0.55 0.69 0.71 0.86 0.83 0.79 1.69 1.8 1.77 1.88 Total Long Term Deht 1.29 1.42 1.37 1.48 0.58 0.56 0.55 0.69 0.71 0.86 0.83 0.79 1.69 1.8 1.77 1.88 0.24 0.24 0.24 0.24 Total Current Liabilities Accounts Payable Payable/Accrued Accrued Expenses Notes Payable/Short Term Debt Current Port of LT Debt/Capital Leases Other Current liabilities, Total Total Liabilities Total Long Term Debt Long Term Debt Capital Lease Obligations Deferred Income Tax Minority Interest Other Liabilities, Total Total Equity Redeemable Preferred Stock, Total Preferred Stock - Non Redeemable, Net Common Stock, Total Additional Paid-In Capital Retained Earnings (Accumulated Deficit) Treasury Stock - Common ESOP Debt Guarantee Unrealized Gain (Loss) Other Equity, Total Total Liabilities & Shareholders' Equity Total Common Shares Outstanding Total Preferred Shares Outstanding 0.16 0.15 0.16 0.16 3.44 3.69 3.84 4.18 2 2 2 2 0.23 -0.29 -0.04 0.11 0.23 1.73 1.73 1.73 1.73 5.13 5.49 5.61 6.06 20 20 20 20 * In Millions of OMR (except for per share items) Financial Ratios Financial performance indicators are based on Third Quarter 2020 ROE % 3.36 ROA % 2.27 EPS 0.01 Net Profit Growth % -17.15 Total Assets Growth % -4.93 Book value growth % -4.97 EPS Growth % -17.14 Cash from operations Growth % 1,001.62 Period Ending: 2020 31/12 2019 31/12 2018 31/12 2017 31/12 12 Months O Months 0 Months 0 Months -0.15 -0.33 -0.26 -0.25 0.15 0.3 0.07 0.28 0.15 0.39 0.35 0.44 -0.08 -0 -0.01 0.04 0.09 -0.06 0.09 0.1 -0.06 -0.22 Period Length: Net Income/Starting Line Cash From Operating Activities Depreciation/Depletion Amortization Deferred Taxes Non-Cash Items Cash Receipts Cash Payments Cash Taxes Paid Cash Interest Paid Changes in Working Capital Cash From Investing Activities Capital Expenditures Other Investing Cash Flow Items, Total Cash From Financing Activities Financing Cash Flow Items Total Cash Dividends Paid Issuance (Retirement) of Stock, Net Issuance (Retirement) of Debt, Net Foreign Exchange Effects Net Change in Cash Beginning Cash Balance Ending Cash Balance Free Cash Flow Free Cash Flow Growth Free Cash Flow Yield -0.12 -0.16 -0.24 -0.26 -0.15 -0.3 0.09 0.04 0.08 0.02 -0.1 -0.1 - - 0.09 -0.05 -0.07 -0.06 0.16 0.2 0.22 0.11 0.13 0.16 -0.09 -0.15 0.02 * In Millions of OMR (except for per share items) Period Ending: Dec 31, 2020 Dec 31, 2019 Dec 31, 2017 Dec 31, 2018 5.61 5.13 5.49 6.06 Total Assets Total Liabilities Total Equity 1.69 1.8 1.77 1.88 3.44 3.69 3.84 4.18 DBCI Cash Flow Statement >> 200k Cash Flow/Share TTM Revenue/Share ITM Operating Cash Flow 0.19 11.63% 100K Cash Net Change in Cash OK -100k 2017 2018 2019 2020 Dec 31, 2020 12 Months Dec 31, 2019 O Months Dec 31, 2018 O Months Dec 31, 2017 O Months 0.15 0.07 0.15 0.28 Period Ending: Period Length: Cash From Operating Activities Cash From Investing Activities Cash From Financing Activities Net Change in Cash -0.06 -0.12 -0.22 -0.24 0 -0.1 0.09 -0.05 -0.07 -0.06 G H x Bags Foot' x + na watumbasim bel/MISWA/DECUTIKSLAS C. Gw We G Wherche .. Gavek se G C MARKETS NEWS. COMPANIES FUNDS. ANALYSIS TOOLS - ISLAVIO FINANCE NLEASHES TU XED INCOVE. PERSONAL O 2019 2015 2017 205 BALANCE SHEET Tulal Assels 5,106,182 5,613.961 6.061.504 6.222.840 6:125.546 Total 1,799.159 1,779 526 1877.404 1,661.814 1 687 419 3,840.435 4.184.01 4.738.177 Total Owners' Equity & Minority interest Faulty Total Liabilities & Sharcholders' Equity 5,455102 5,613.561 0.001.504 425.54 INCOME STATEMENT Not Income or los -158.412 -325.118 -277024 173.007 313916 Gross Pratr 2,120.7011 2208.535 2,563.3 CASH FLOW NAT Cash Flow from(used in Oberating Activiti 65995 149.995 276 18 581.84 761 656 LA - 118.45 238 844 243.223 1801 lil Net Dash Flow from (Used In Investing Activities Net Cashion from (Used In) Financing Activities Nel Change In Cash & Cast Equivalents 100 404.952 5/5.250 52.591 -67.632 -62664 -66.335 66.722 W > Way Sweden. 1838 Dela Bex -6.9% -4.32% 29.41% 34.21% 15.63% Return on Equity TTM Return on Equity 5YA Return on Assets ITM Return on Assets SYA Return on Investment TTM Return on Investment 5YA -4.63% -3.01% 22.25% -6.22% 24.3% -3.94% 25.22% -37.33% 48.65% -37.28% 11.95% 25.45% EPS(MRO) vs Qtr. 1 Yr. Ago MRQ EPS(TTM) vs TTM 1 Yr. Ago TTM 5 Year EPS Growth SYA Sales (MRO) vs Qtr. 1 Yr. Ago MRQ Sales (TTM) vs TTM 1 Yr. Ago TTM 5 Year Sales Growth SYA 5 Year Capital Spending Growth SYA -8.99% 1.43% -9.89% 4.88% -7.76% 11.13% -16.28% 38.3% 0.58 0.95 1.1 1.25 0% 12.12% 20.6% 42.53% Quick Ratio MRQ Current Ratio MRO LT Debt to Equity MRQ Total Debt to Equity MRQ Efficiency Asset Turnover TTM Inventory Turnover TTM Revenue/Employee TTM Net Income/Employee TTM Receivable Turnover TTM 0.71 1.23 3.31 6.43 6.44 15.66 4.6% 4.28% Dividend Yield ANN Dividend Yield 5 Year Avg. SYA Dividend Growth Rate ANN Payout Ratio TTM 2% 47.13
Step by Step Solution
There are 3 Steps involved in it

Get step-by-step solutions from verified subject matter experts