

Question: HELP me to solve these problems thanks The following is a portion of a classic data set called the pilot plot data in Fitting Equations
HELP me to solve these problems thanks
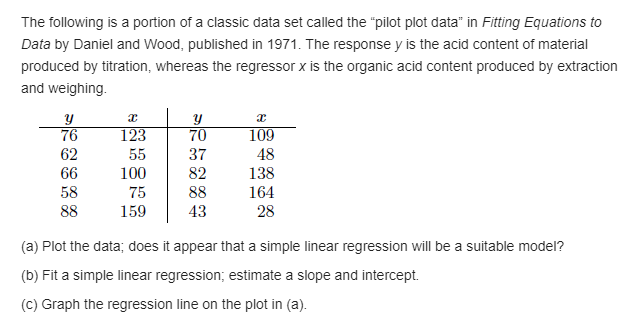
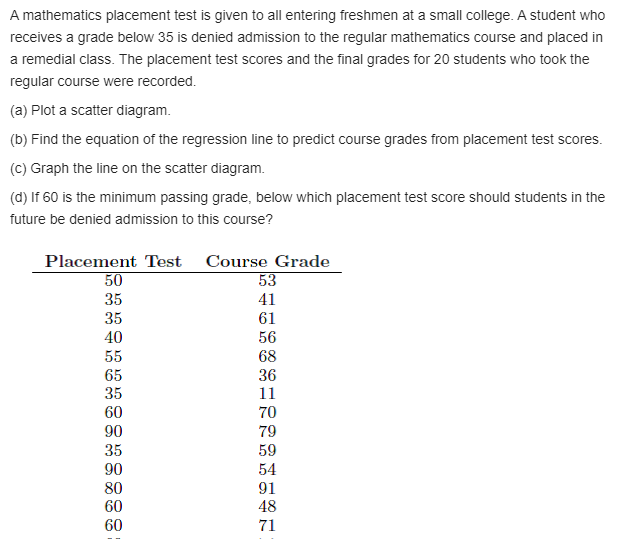
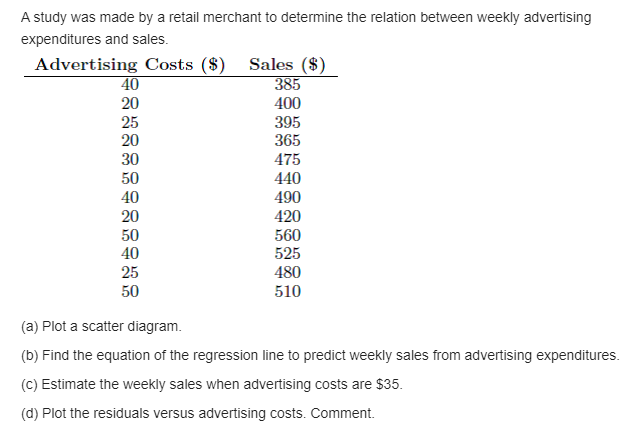
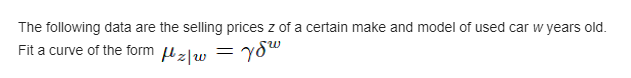
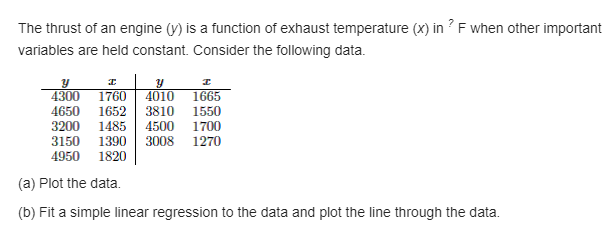
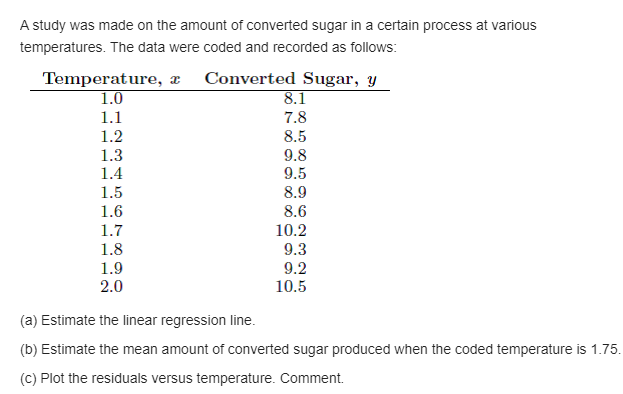
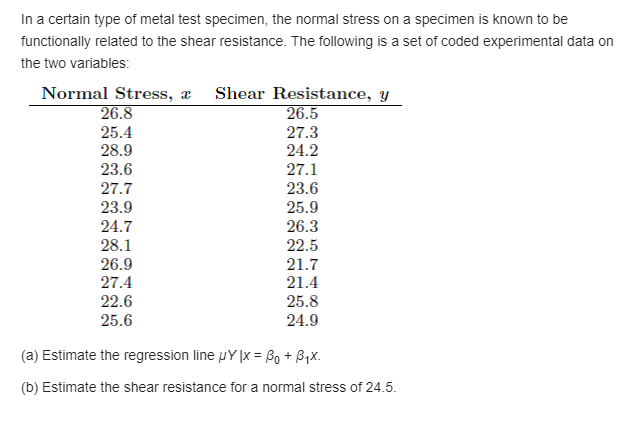
The following is a portion of a classic data set called the \"pilot plot data" in Fitting Equations to Data by Daniel and Wood, published in 19?1. The response 1.: is the acid content of material produced by titration, whereas the regressor Jr is the organic acid content produced by extraction and weighing. y m y 3 7'6 123 TH 1119 I52 55 3? 48 EB 1E") 82 138 53 T5 88 164 33 15E!I 43 28 {a} Plot the data; does it appear that a simple linear regression will be a suitable model? to) Fit a simple linear regression; estimate a slope and intercept {c} Graph the regression line on the plot in {a}. A mathematics placement test is given to all entering freshmen at a small college. A student who receives a grade below 35 is denied admission to the regular mathematics course and placed in a remedial class. The placement test scores and the final grades for 20 students who took the regular course were recorded. (a) Plot a scatter diagram. (b) Find the equation of the regression line to predict course grades from placement test scores. (c) Graph the line on the scatter diagram. (d) If 60 is the minimum passing grade, below which placement test score should students in the future be denied admission to this course? Placement Test Course Grade 50 53 35 41 35 61 40 56 55 68 65 36 35 60 90 79 35 59 90 54 80 91 60 48 60 71A stud}:r was made by a retail merchant to determine the relation between weeldglr adverljsing exoenditu res and sales. Advertising Costs [95} Sales [$} 335 40D 395 365 AWE 441] 491] 421] 561] 525 43D 51D EEESEEEEEEEE {a} Plot a scatter diagram. {o} Find the equation of the regression line to predict weeldy.r sales li'om advertising expenditures. {o} Estimate the weekly sales when advertising costs are $35. {d} Plot the residuals versus advertising costs. Comment. The following data are the selling prices z of a certain make and model of used car w years old. Fit a curve of the form /zw = yowThe thrust of an engine {y} is a function of exhaust temperature (I) in ? F 1when other important vanaoles are held oonsta nt. Consider the following data. 431]} WED 4D1 1565 46m 1652 381D 155D soon 1485 45m woo 31m 139i] 3003 12m 49% 182 {a} Plot the data. {on} Fit a simple linear regression to the data and plintthe line through the data. A stud}:r was made on the amount of converted sugar in a certain process at various temperatures. The data 1were coded and recorded as follows: Temperature, 3 Converted Sugar, 3; 1.9 3.1 1.1 T3 1.2 3.5 1.3 9.3 1.4 9.5 1.5 3.9 1.3 3.9 1.7 19.2 1.3 9.3 1.9 9.2 2.9 19.5 {a} Estimate the linear regression line. to) Estimate the mean amount of converted sugar produced when the coded temperature is 1.?5. {c} Plot the residuals versus temperature. Comment In a certain type of metal test specimen, the normal stress on a specimen is known to he functionallyr related to the shear resistance. The following is a set of coded experimental data on the two variables: Normal E'i'l'J'ess,r a: Shear Resistance, 3; 25.8 25.5 25.4 2?.3 28.9 24.2 23.5 2T.1 23.? 23.5 23.9 25.9 24.? 25.3 28.1 22.5 25.9 21.? 214 21.4 22.5 25.8 25.5 24.9 {a} Estimate the regression line p'rpr: Bo + 31x. {5) Estimate the shear resistanoe for a normal stress of 24.5
Step by Step Solution
There are 3 Steps involved in it

Get step-by-step solutions from verified subject matter experts