

Question: Help me with that please. Part A: Below you have been given data for the number of active coronavirus cases in Canada and the United
Help me with that please.
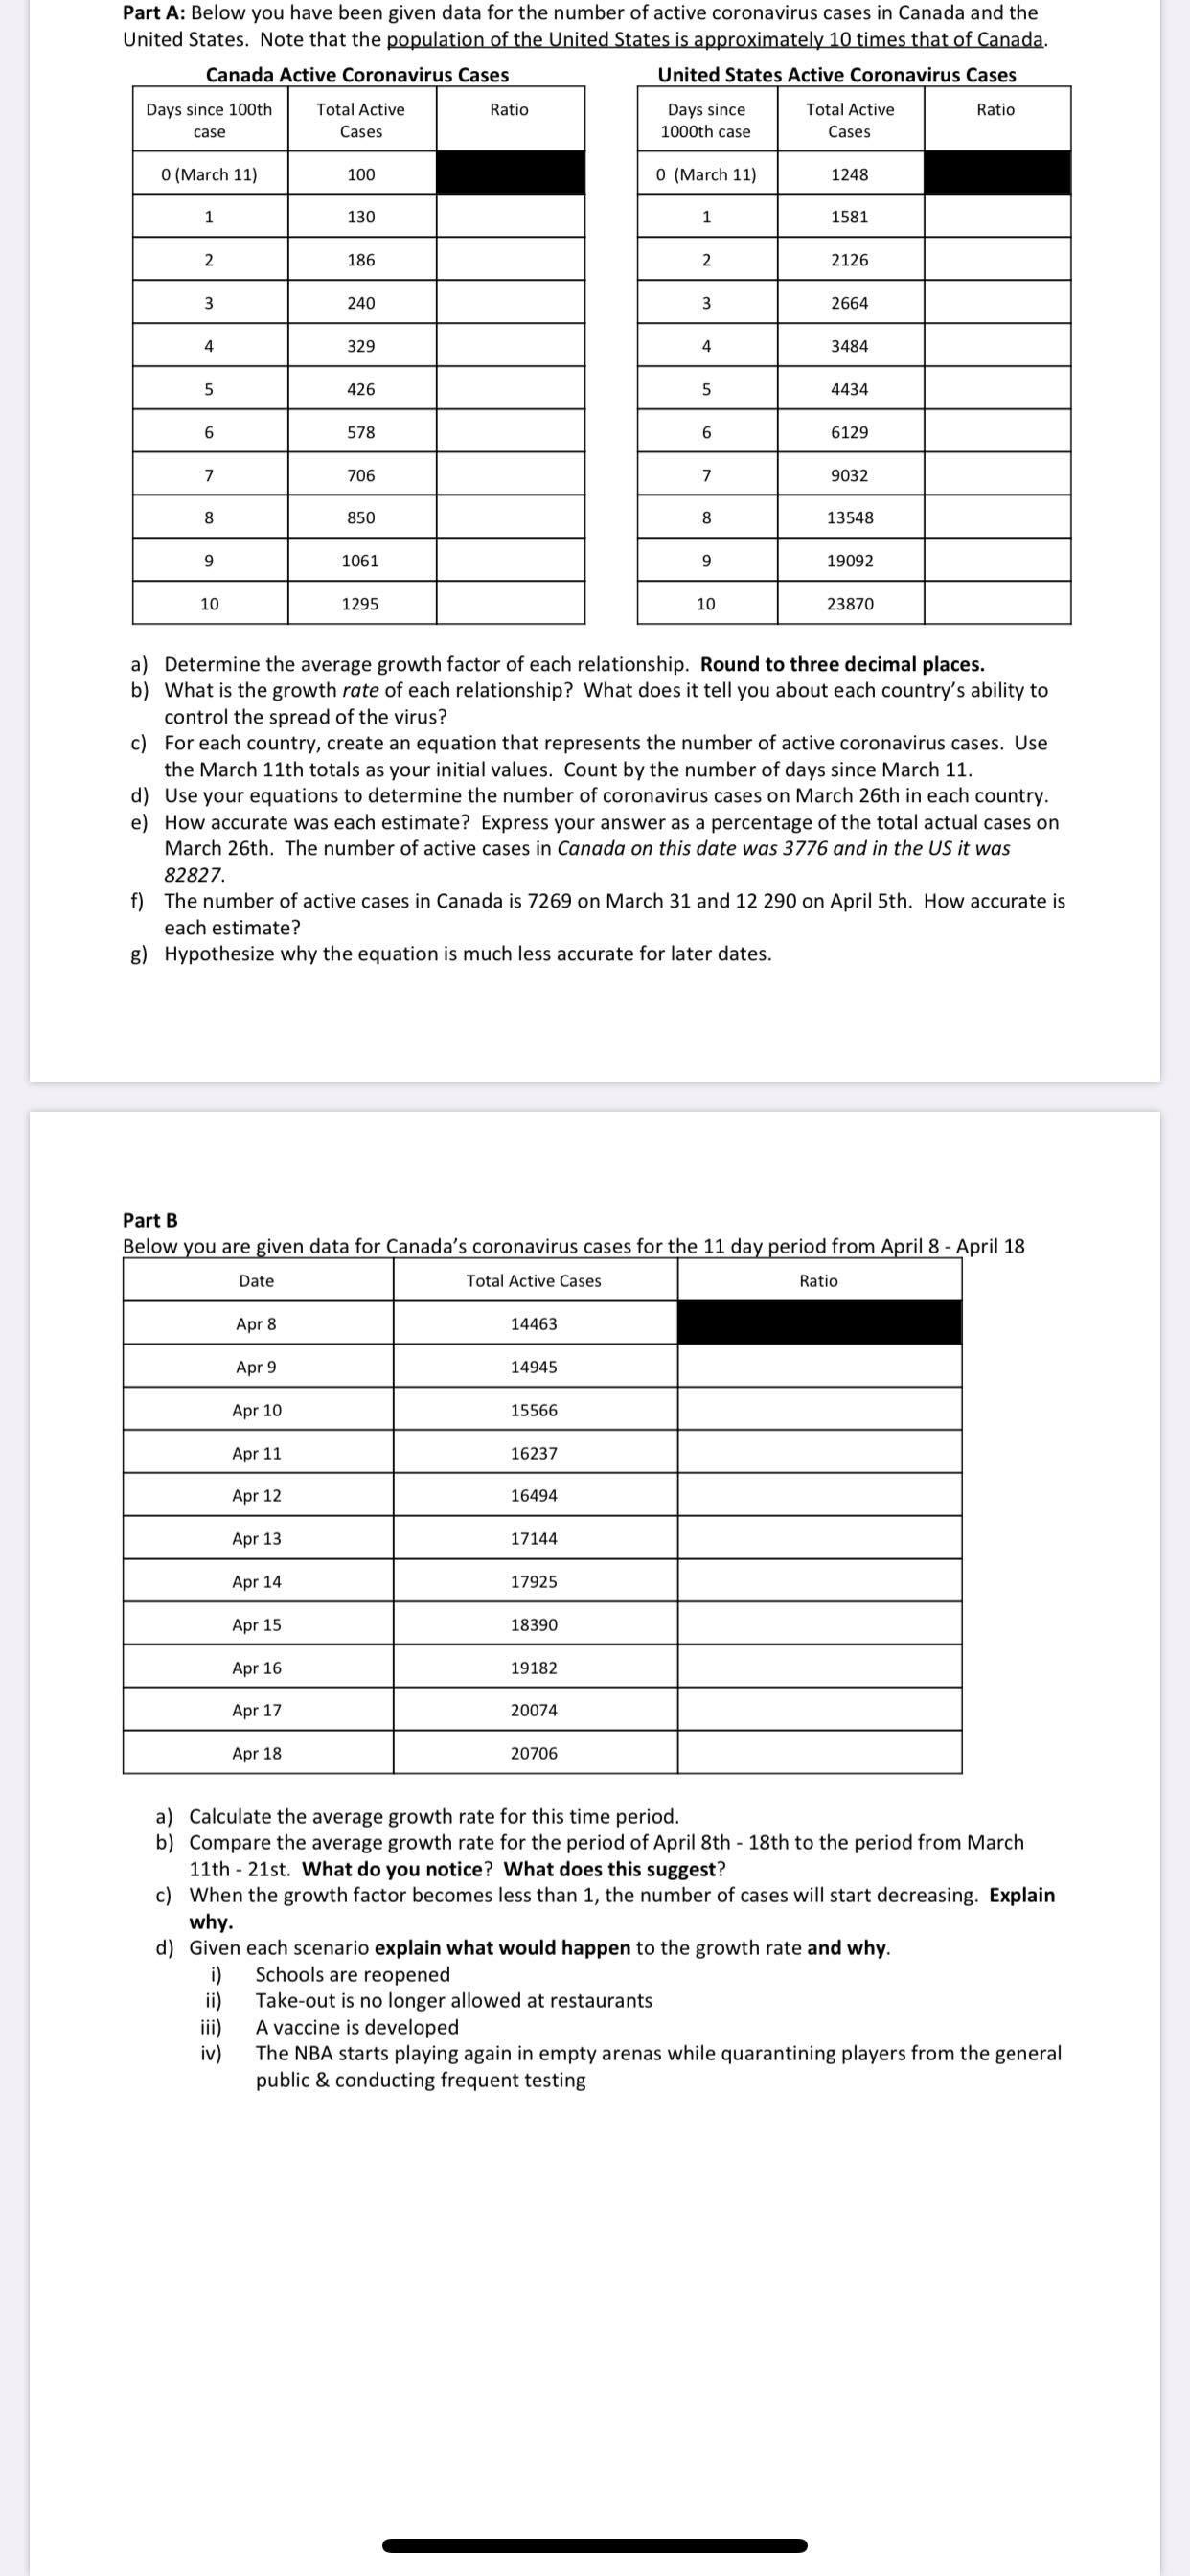
Part A: Below you have been given data for the number of active coronavirus cases in Canada and the United States. Note that the population of the United States is approximately 10 times that of Canada. Canada Active Coronavirus Cases United States Active Coronavirus Cases Days since 100th Total Active Ratio Days since Total Active Ratio case Cases 1000th case Cases 0 (March 11) 100 0 (March 11) 1248 1 130 1 1581 2 186 2 2126 3 240 3 2664 4 329 4 3484 5 426 5 4434 6 578 6 6129 7 706 7 9032 8 850 8 13548 9 1061 9 1909 10 1295 10 23870 a) Determine the average growth factor of each relationship. Round to three decimal places. b) What is the growth rate of each relationship? What does it tell you about each country's ability to control the spread of the virus? c) For each country, create an equation that represents the number of active coronavirus cases. Use the March 11th totals as your initial values. Count by the number of days since March 11. d) Use your equations to determine the number of coronavirus cases on March 26th in each country. e) How accurate was each estimate? Express your answer as a percentage of the total actual cases on March 26th. The number of active cases in Canada on this date was 3776 and in the US it was 82827. f) The number of active cases in Canada is 7269 on March 31 and 12 290 on April 5th. How accurate is each estimate? g) Hypothesize why the equation is much less accurate for later dates. Part B Below you are given data for Canada's coronavirus cases for the 11 day period from April 8 - April 18 Date Total Active Cases Ratio Apr 14463 Apr 9 14945 Apr 10 15566 Apr 11 16237 Apr 12 16494 Apr 13 17144 Apr 14 17925 Apr 15 18390 Apr 16 19182 Apr 17 20074 Apr 18 20706 a) Calculate the average growth rate for this time period. b) Compare the average growth rate for the period of April 8th - 18th to the period from March 11th - 21st. What do you notice? What does this suggest? c) When the growth factor becomes less than 1, the number of cases will start decreasing. Explain why. d) Given each scenario explain what would happen to the growth rate and why. Schools are reopened ii) Take-out is no longer allowed at restaurants ifi) A vaccine is developed iv) The NBA starts playing again in empty arenas while quarantining players from the general public & conducting frequent testing
Step by Step Solution
There are 3 Steps involved in it

Get step-by-step solutions from verified subject matter experts