

Question: Help me with this problem 1. Construct a frequency histogram for observed waiting times (in minutes) in Walmart cashier lines, using the following data. Use
Help me with this problem
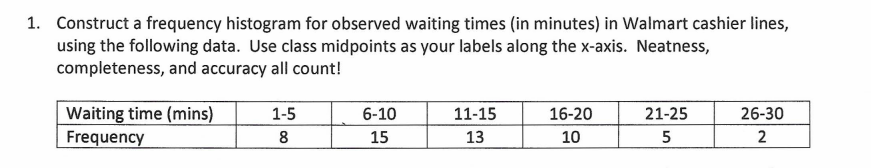
1. Construct a frequency histogram for observed waiting times (in minutes) in Walmart cashier lines, using the following data. Use class midpoints as your labels along the x-axis. Neatness, completeness, and accuracy all count! Waiting time (mins) 1-5 6-10 11-15 16-20 21-25 26-30 Frequency 8 15 13 10 5 2
Step by Step Solution
There are 3 Steps involved in it
1 Expert Approved Answer
Step: 1 Unlock

Question Has Been Solved by an Expert!
Get step-by-step solutions from verified subject matter experts
Step: 2 Unlock
Step: 3 Unlock