

Question: help me with this stat problem D Question 1 4 pts The number of forest fires per year in California have a distribution conforming to
help me with this stat problem
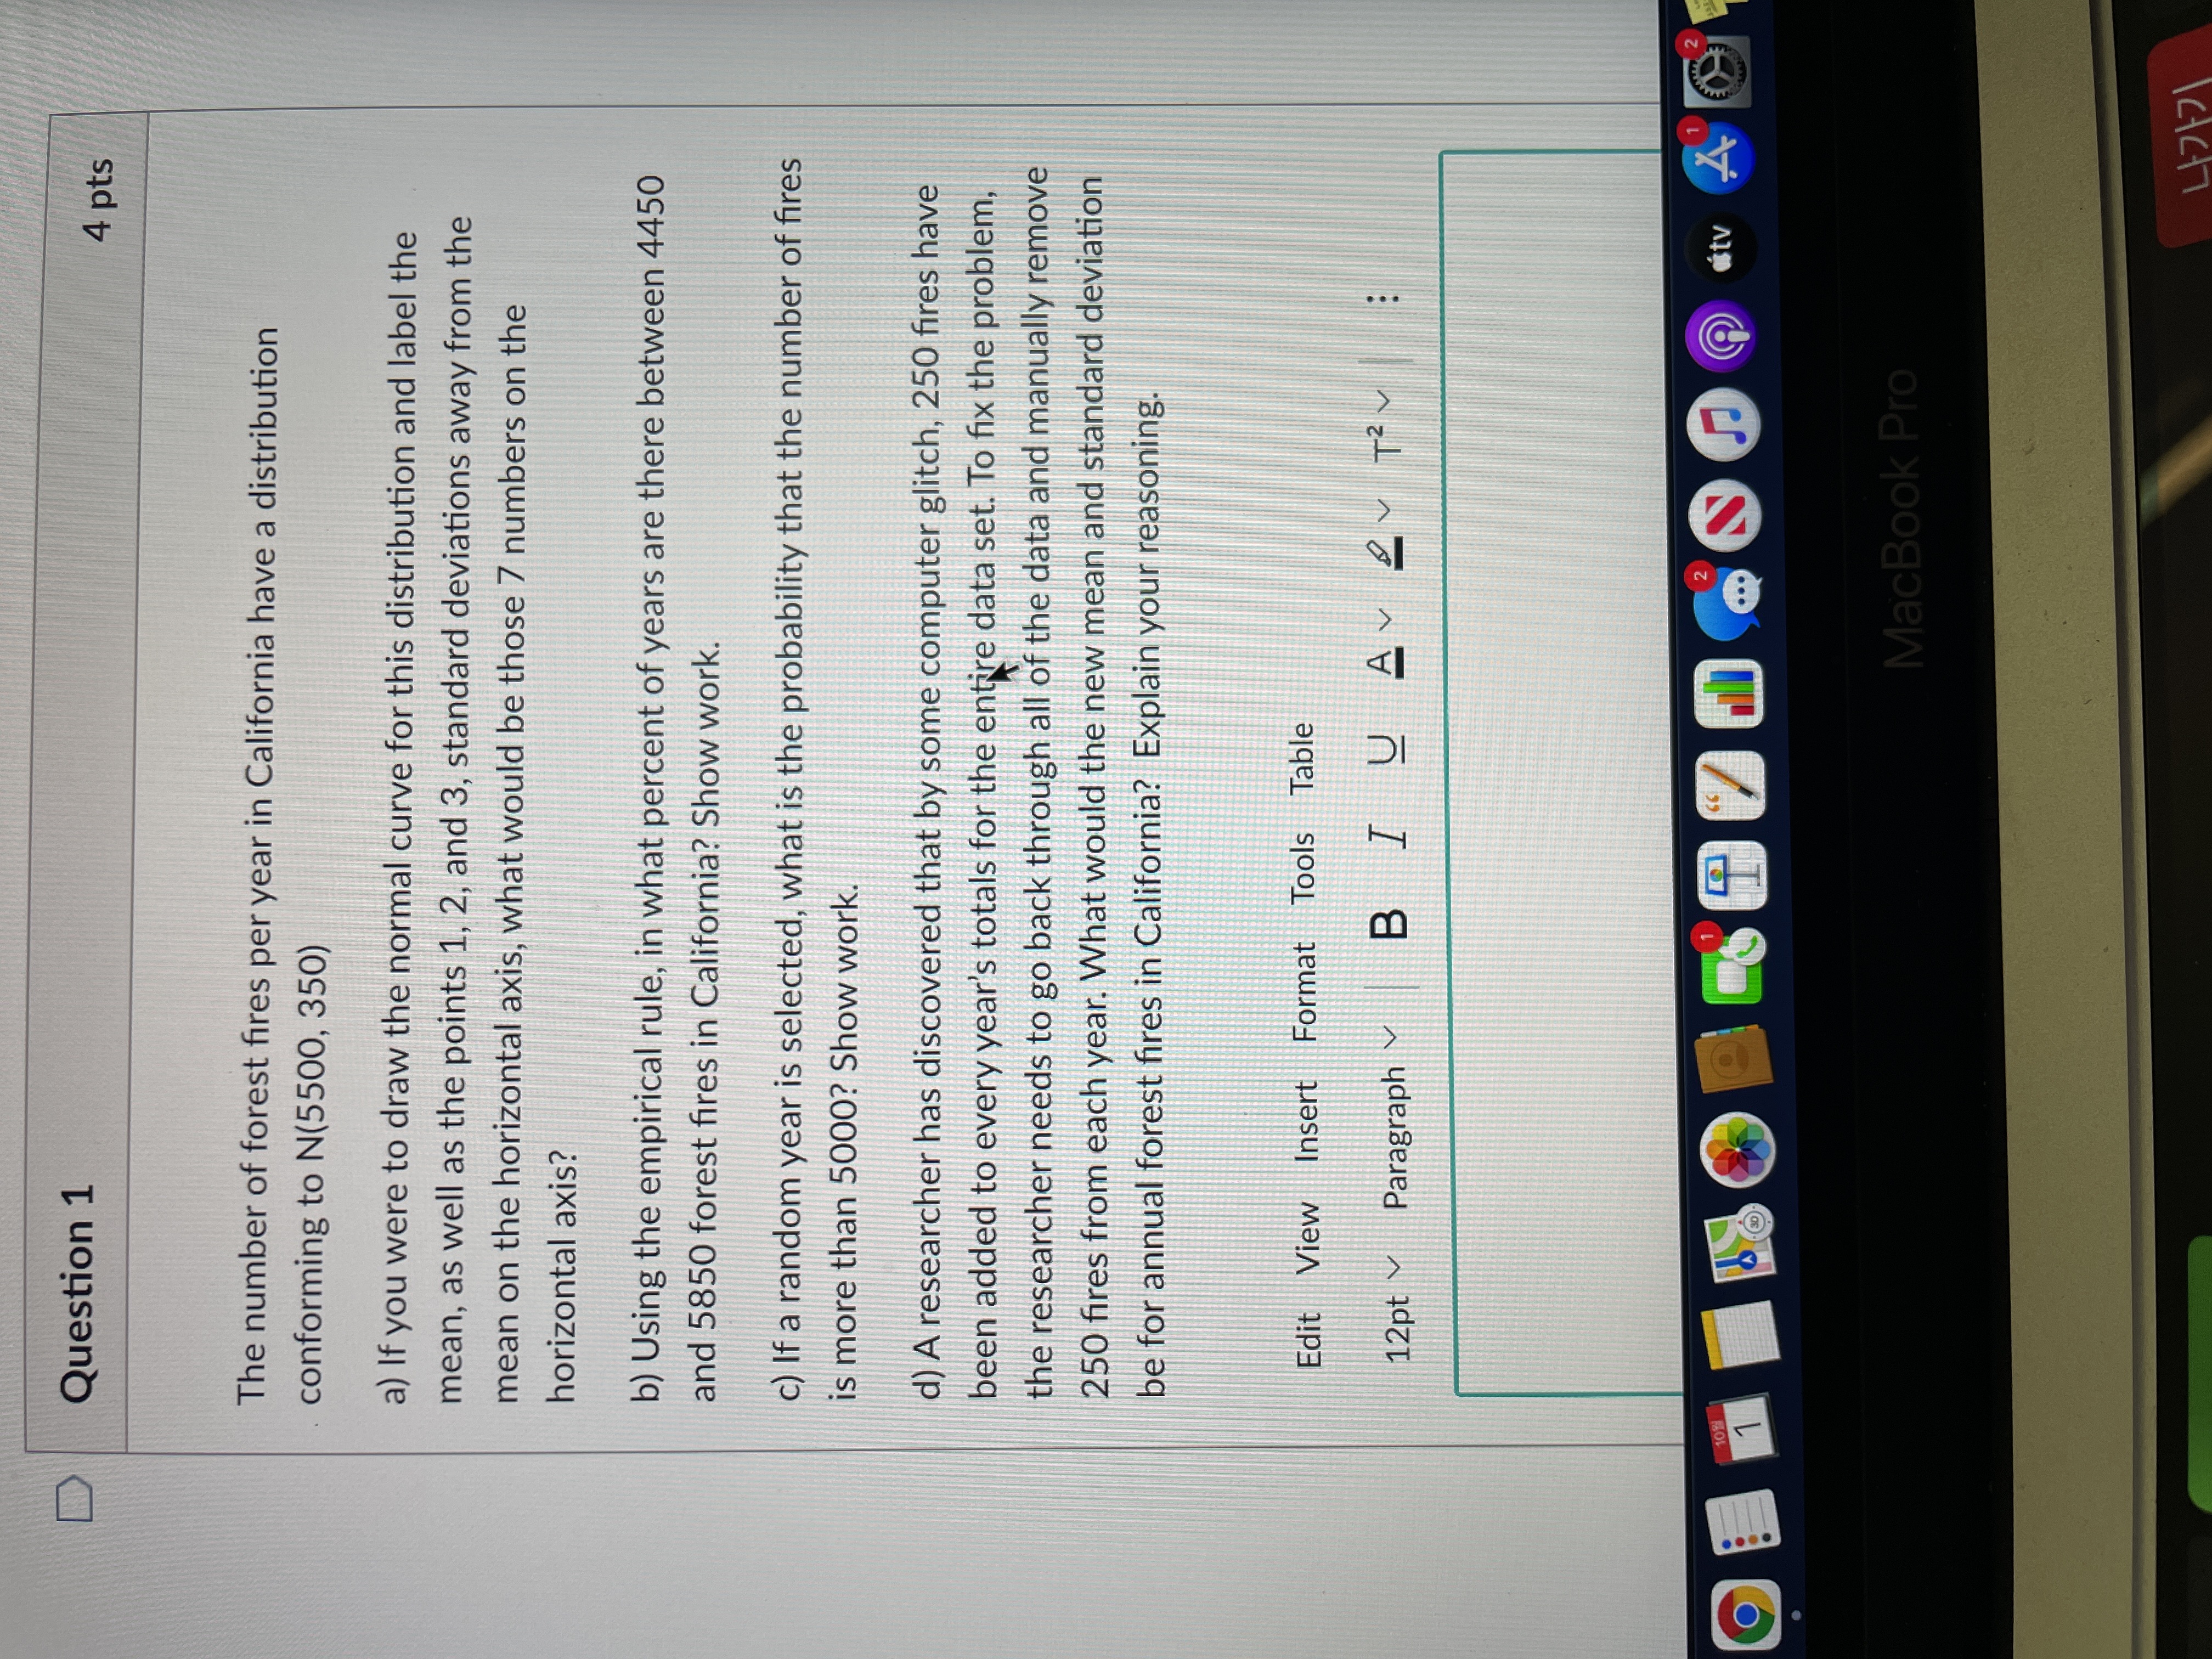
D Question 1 4 pts The number of forest fires per year in California have a distribution conforming to N(5500, 350) a) If you were to draw the normal curve for this distribution and label the mean, as well as the points 1, 2, and 3, standard deviations away from the mean on the horizontal axis, what would be those 7 numbers on the horizontal axis? b) Using the empirical rule, in what percent of years are there between 4450 and 5850 forest fires in California? Show work. c) If a random year is selected, what is the probability that the number of fires is more than 5000? Show work. d) A researcher has discovered that by some computer glitch, 250 fires have been added to every year's totals for the entire data set. To fix the problem, the researcher needs to go back through all of the data and manually remove 250 fires from each year. What would the new mean and standard deviation be for annual forest fires in California? Explain your reasoning. Edit View Insert Format Tools Table 12pt ~ Paragraph B J U A & 2 V . .. istv A 1 O MacBook Pro
Step by Step Solution
There are 3 Steps involved in it

Get step-by-step solutions from verified subject matter experts