

Question: H.E.L.P. My assignment is due tonight! My class is called Data Analysis and Business Analytics, which deals with Statistics. My assignment (which consists of 15
H.E.L.P. My assignment is due tonight!
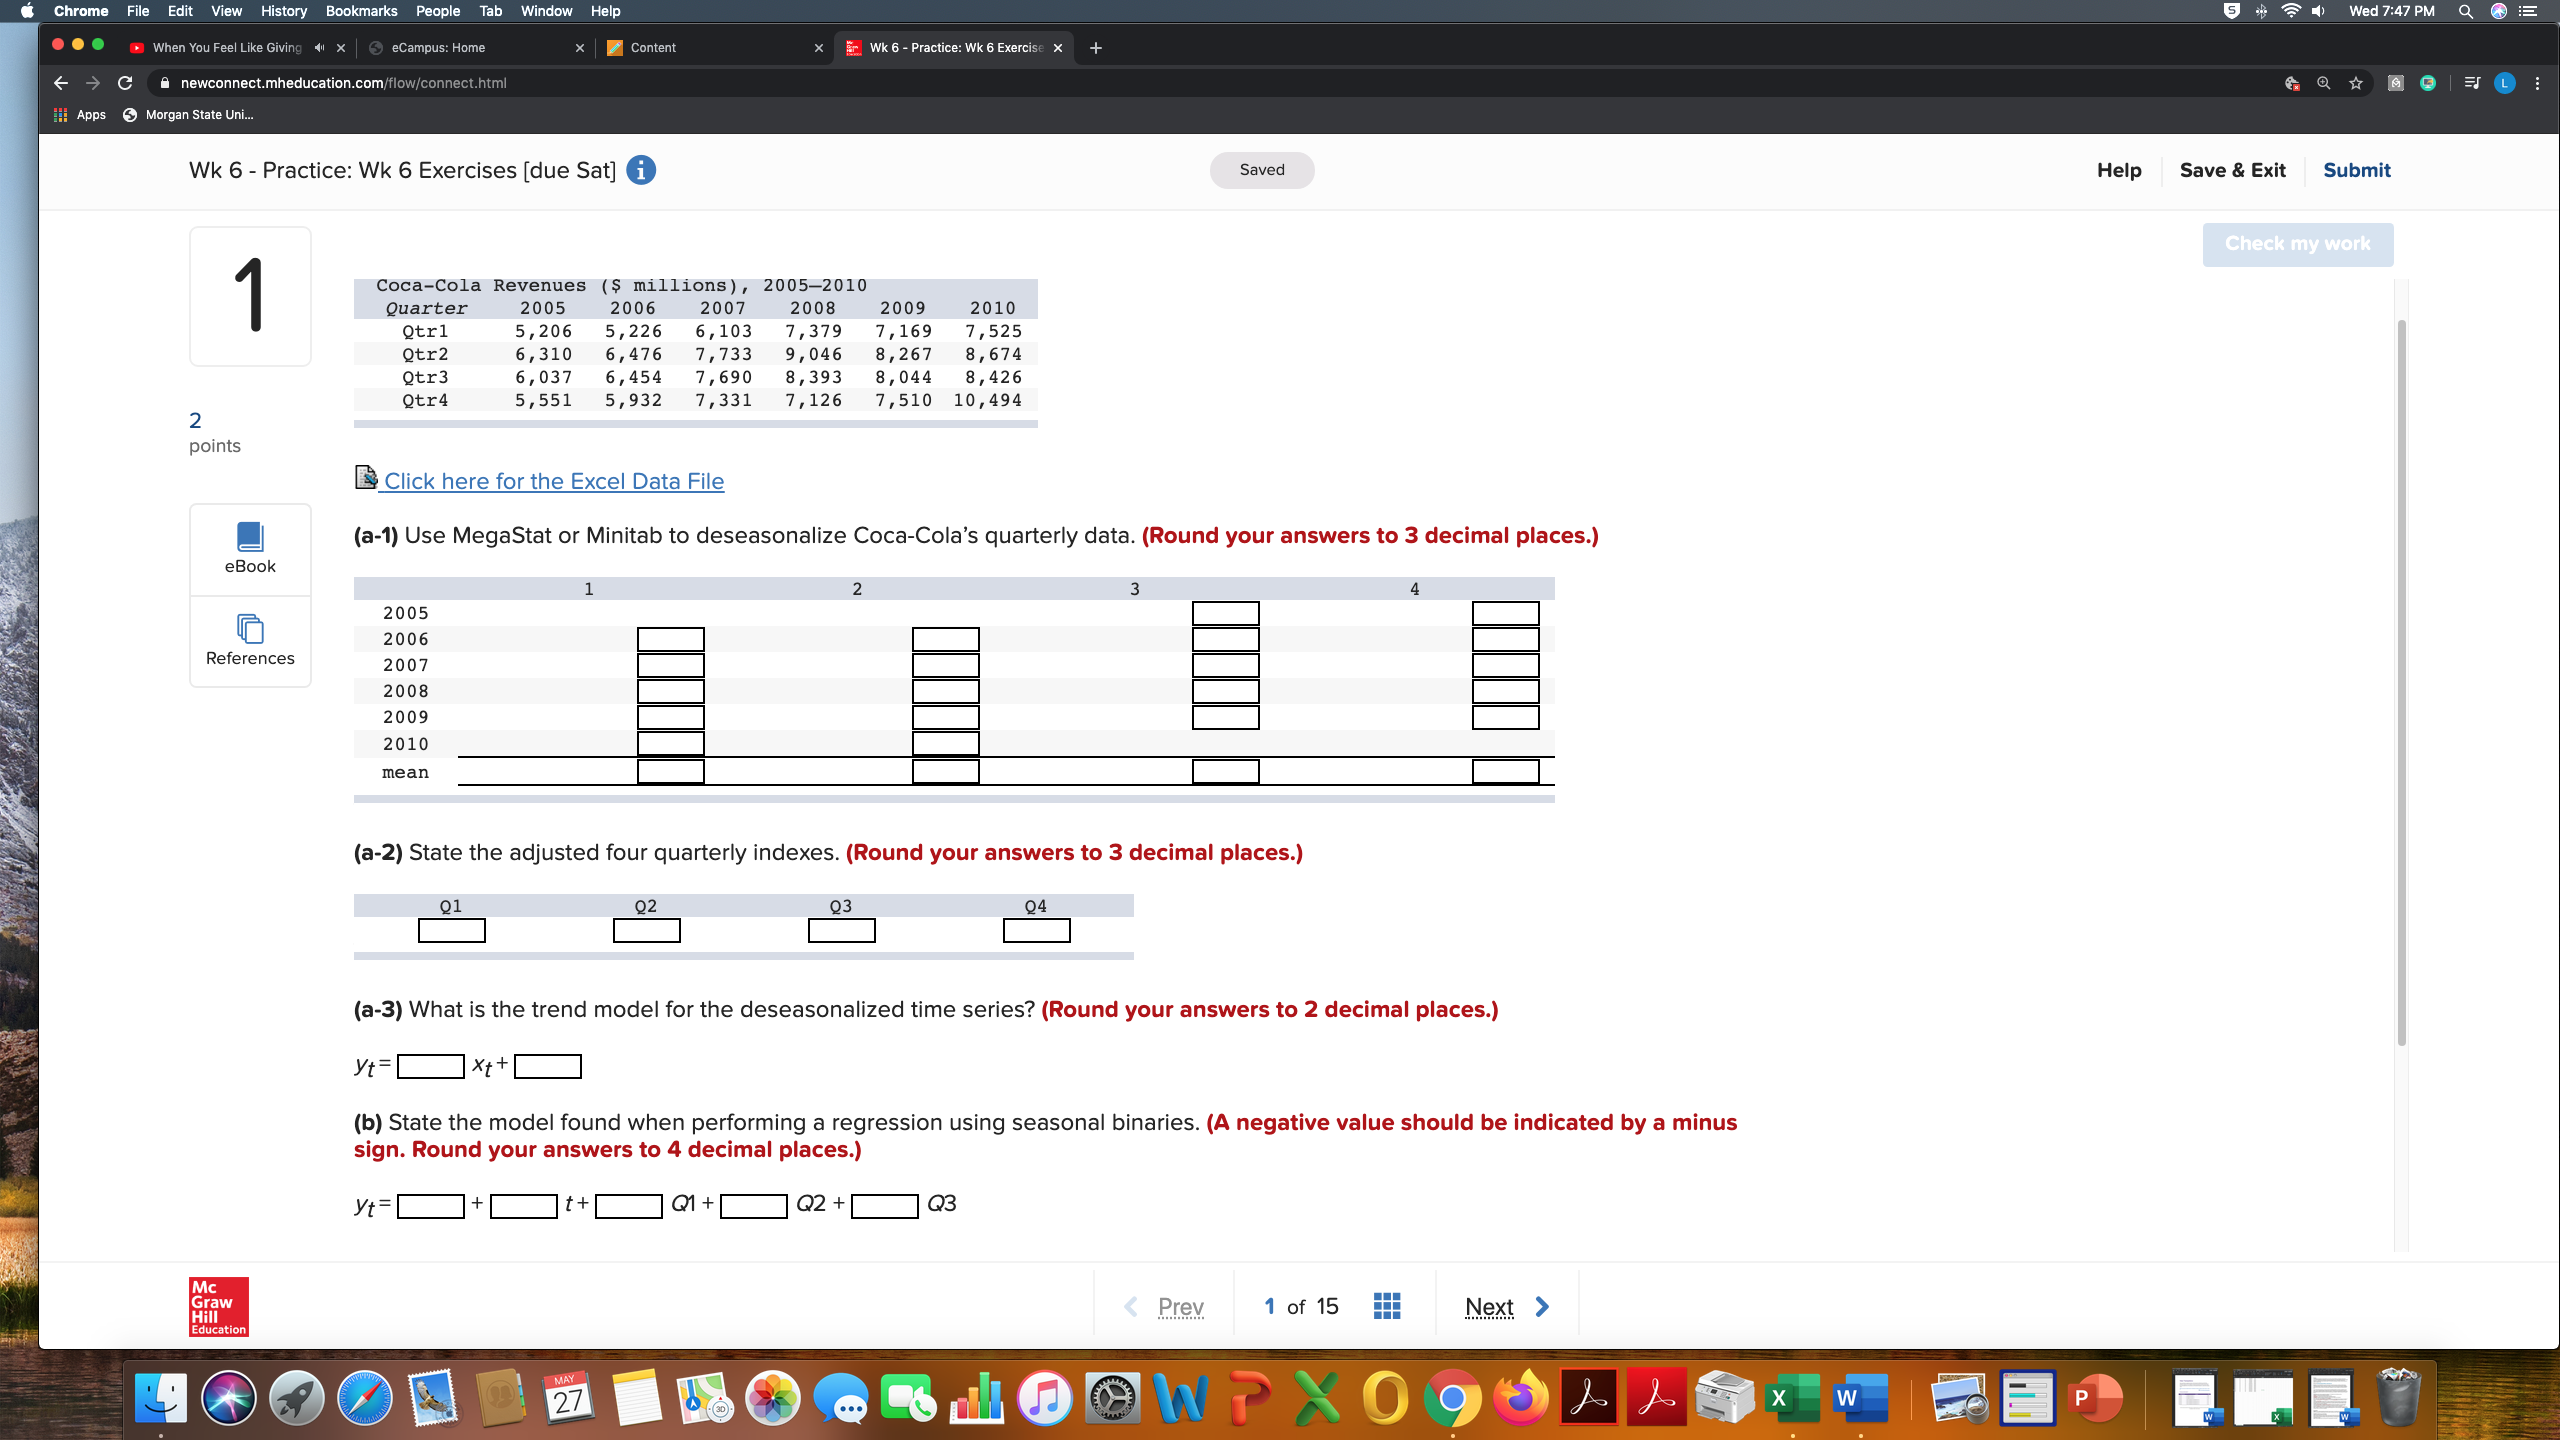
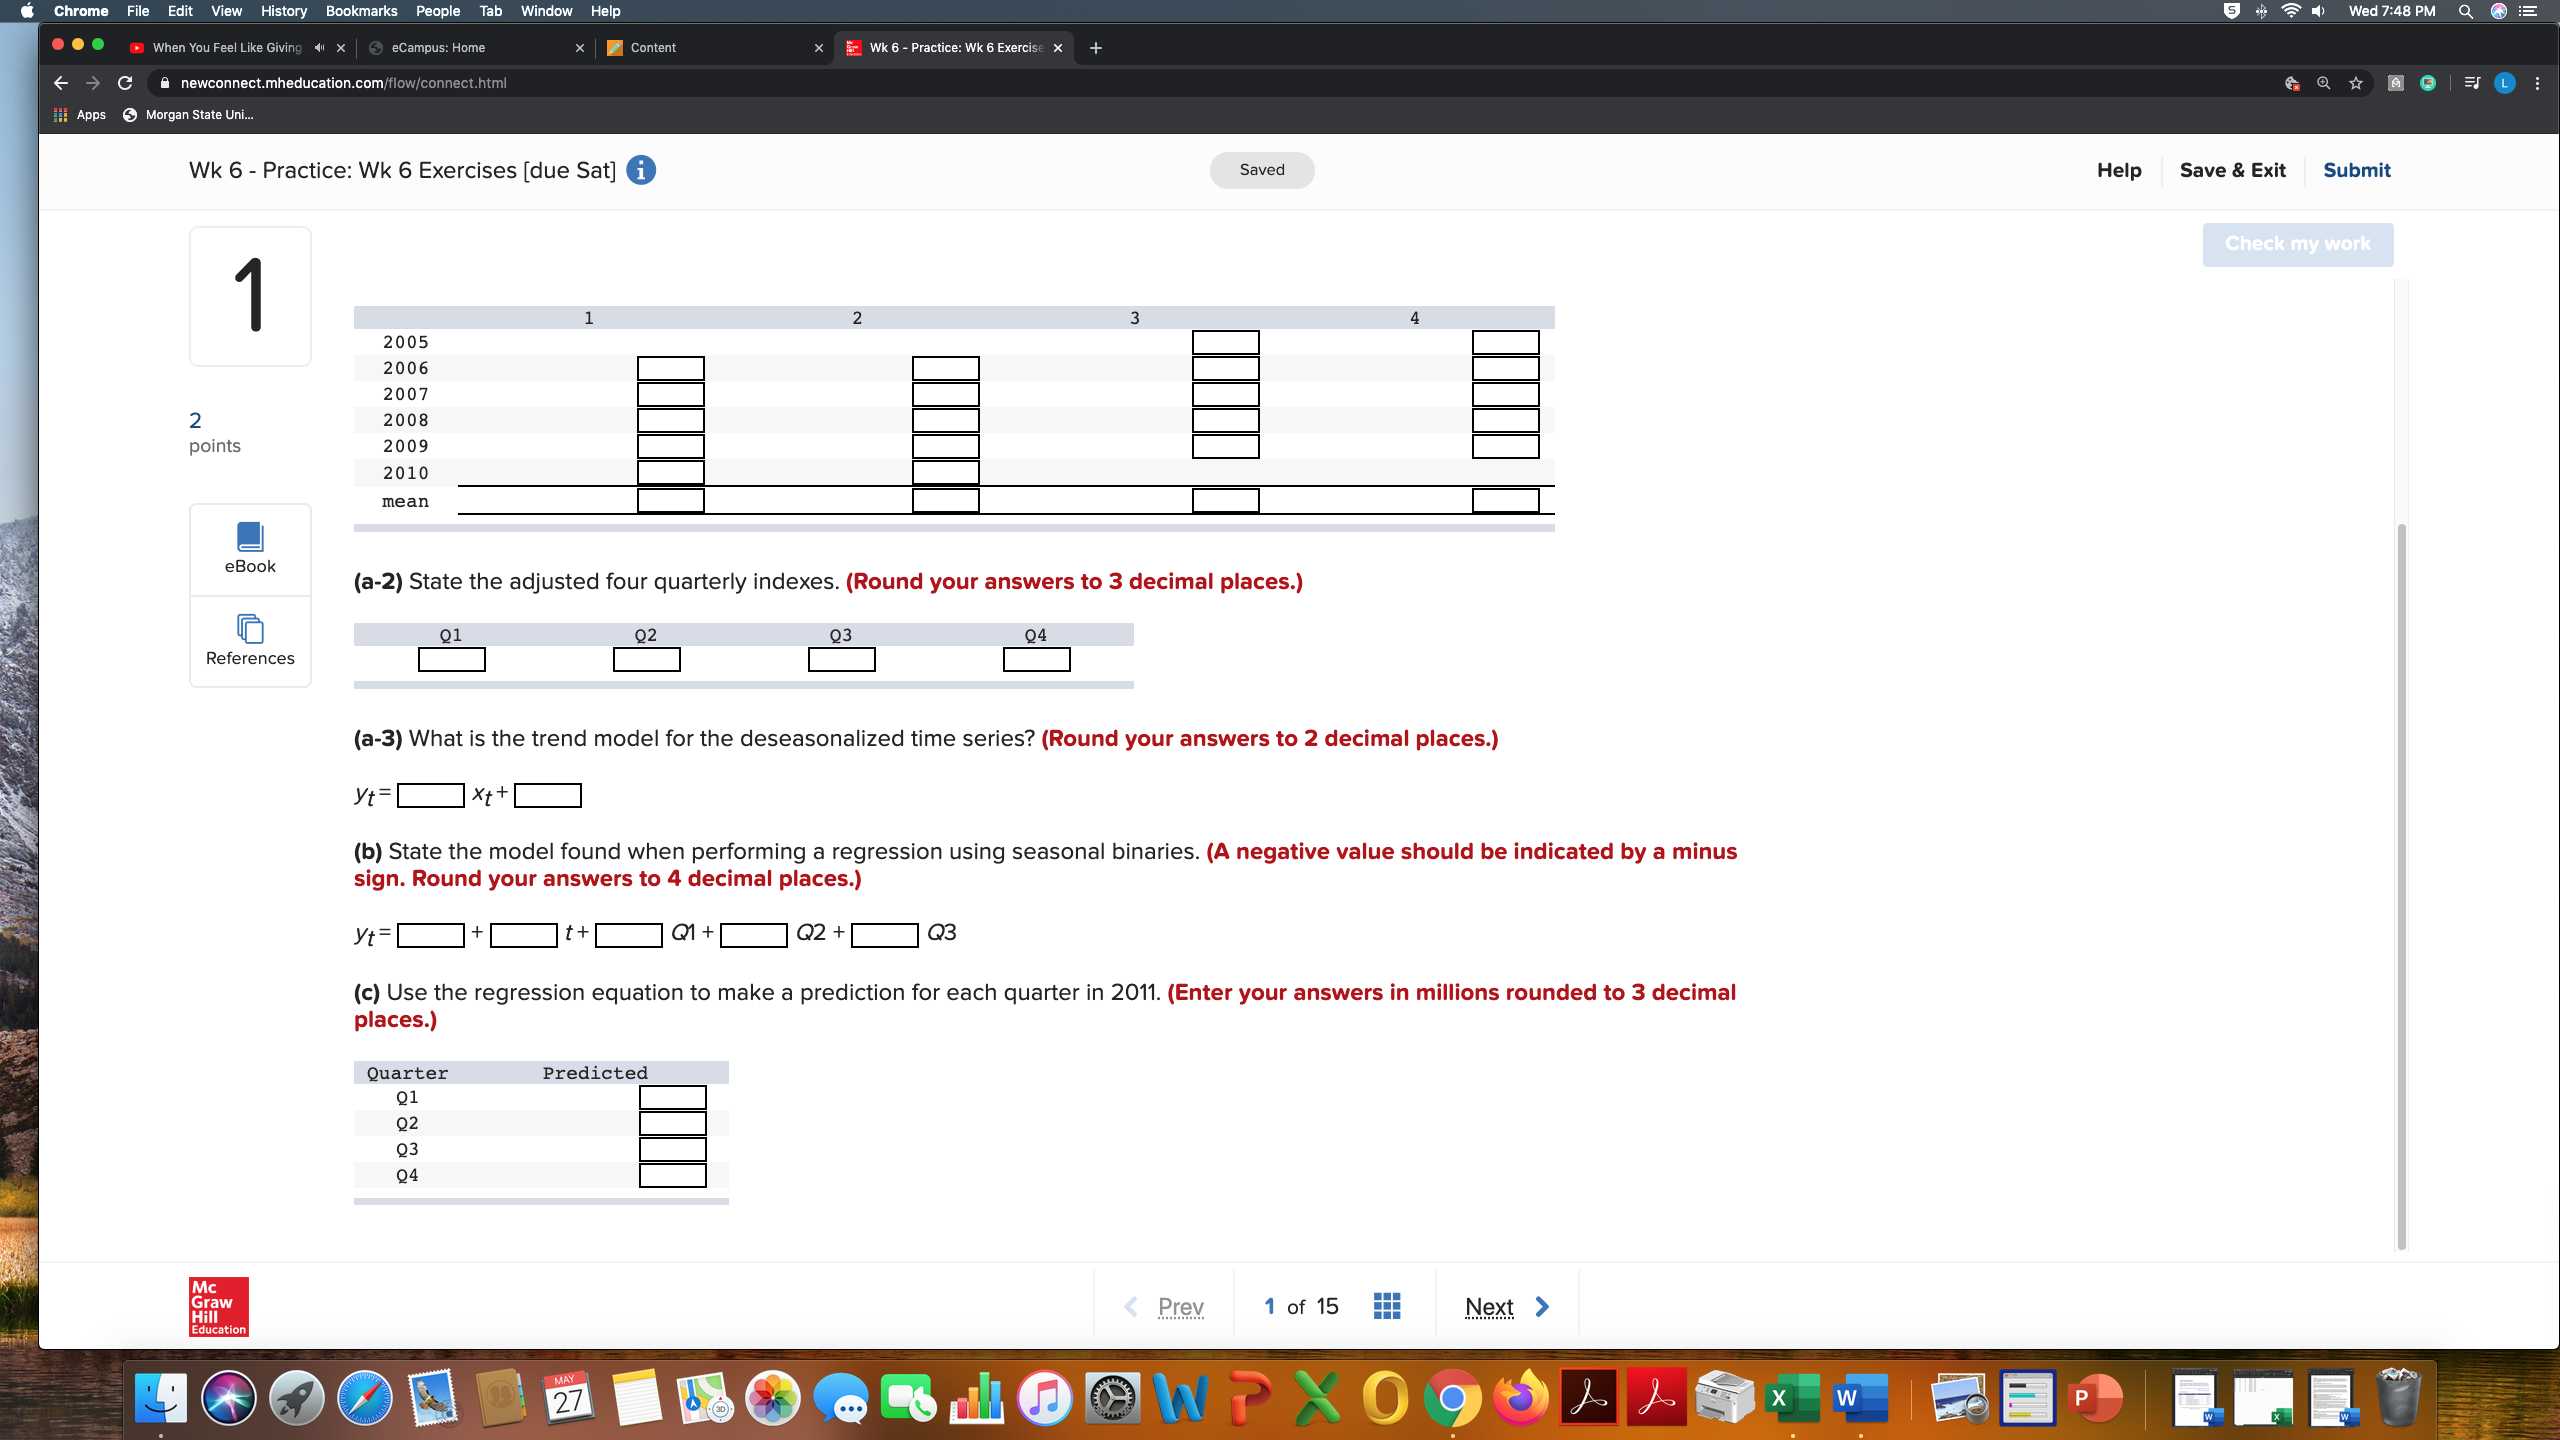
My class is called Data Analysis and Business Analytics, which deals with Statistics. My assignment (which consists of 15 questions) deals with regression, seasonal indexes, linear trends, exponential trends, quadratic trends, moving averages, (using Megastab
or Minitab software to calculate seasonal indexes and trend) and other concepts which are confusing. Please refer to the instructions on the Screenshots that I will send. A screenshot of an Excel file will accompany the screenshots. I can not upload the Excel file or the Word file. Do I will copy and paste the data onto this form.
Quarterly Revenue for Coca Cola Company, 2005-2010 (millions of dollars)
Year
Quarter
Revenue
2005
Qtr1
5,206
Qtr2
6,310
Qtr3
6,037
Qtr4
5,551
2006
Qtr1
5,226
Qtr2
6,476
Qtr3
6,454
Qtr4
5,932
2007
Qtr1
6,103
Qtr2
7,733
Qtr3
7,690
Qtr4
7,331
2008
Qtr1
7,379
Qtr2
9,046
Qtr3
8,393
Qtr4
7,126
2009
Qtr1
7,169
Qtr2
8,267
Qtr3
8,044
Qtr4
7,510
2010
Qtr1
7,525
Qtr2
8,674
Qtr3
8,426
Qtr4
10,494
In row-column format
Quarter
2005
2006
2007
2008
2009
2010
Qtr1
5,206
5,226
6,103
7,379
7,169
7,525
Qtr2
6,310
6,476
7,733
9,046
8,267
8,674
Qtr3
6,037
6,454
7,690
8,393
8,044
8,426
Qtr4
5,551
5,932
7,331
7,126
7,510
10,494
Chrome File Edit View History Bookmarks People Tab Window Help 5 Wed 7:47 PM . . . When You Feel Like Giving 1 X | eCampus: Home x Content Wk 6 - Practice: Wk 6 Exercise x + newconnect.mheducation.com/flow/connect.html III Apps Morgan State Uni. Wk 6 - Practice: Wk 6 Exercises [due Sat] i Saved Help Save & Exit Submit Check my work Coca-cola Revenues ($ millions ) , 2005-2010 Quarter 2005 2006 2007 2008 2009 2010 Qtr1 5, 206 5, 226 6, 103 7,379 7, 169 7,525 Qtr2 6, 310 6, 476 7, 733 9 , 046 8 , 267 8 , 674 Qtr3 6, 037 6 , 454 7, 690 8,393 8 , 044 8, 426 Qtr4 5 , 551 5 ,932 7, 331 7, 126 7,510 10, 494 2 points Click here for the Excel Data File (a-1) Use MegaStat or Minitab to deseasonalize Coca-cola's quarterly data. (Round your answers to 3 decimal places.) eBook 2005 2006 References 2007 2008 2009 2010 mean (a-2) State the adjusted four quarterly indexes. (Round your answers to 3 decimal places.) (a-3) What is the trend model for the deseasonalized time series? (Round your answers to 2 decimal places.) ytxt+ (b) State the model found when performing a regression using seasonal binaries. (A negative value should be indicated by a minus sign. Round your answers to 4 decimal places. yt = ]+ +a+]Q2+Q3 graw 1 of 15 Education L MAY 27 X W PI' cmm me (am View Hmry Bookmarks Peanle Tab 1 points eEook Ti Relerences 2005 2005 2007 2003 2009 201i) mean (8-2) State the adjusted four quarterly indexes, (Round your answers to 3 decimal places.) (a-3) What is the trend model for the deseasonalized time series? (Round your answers to 2 decimal places.) Vt: (b) State the model found when performing a regression using seasonal binaries (A negative value should be Indicated by a minus Window Help Wk 6 - Practice: Wk 6 Exercises [due Sat] 0 l | Saved Help Save 8. El" Submit II III III 91 02 03 Qt Xt+| sign. Round your answers to 4 decimal places.) if (c) Use the regression equation to make a prediction for each quarter in 2011. (Enter your answers in millions rounded to 3 decimal +| t+| 01+ 02+ 03 places.) Quarter 01 122 Q3 124 Predicted laieeoenem
Step by Step Solution
There are 3 Steps involved in it

Get step-by-step solutions from verified subject matter experts