

Question: Help needed please a The graph shows Spain's demand for and supply of oranges. Draw the world price line when the world price of oranges
Help needed please
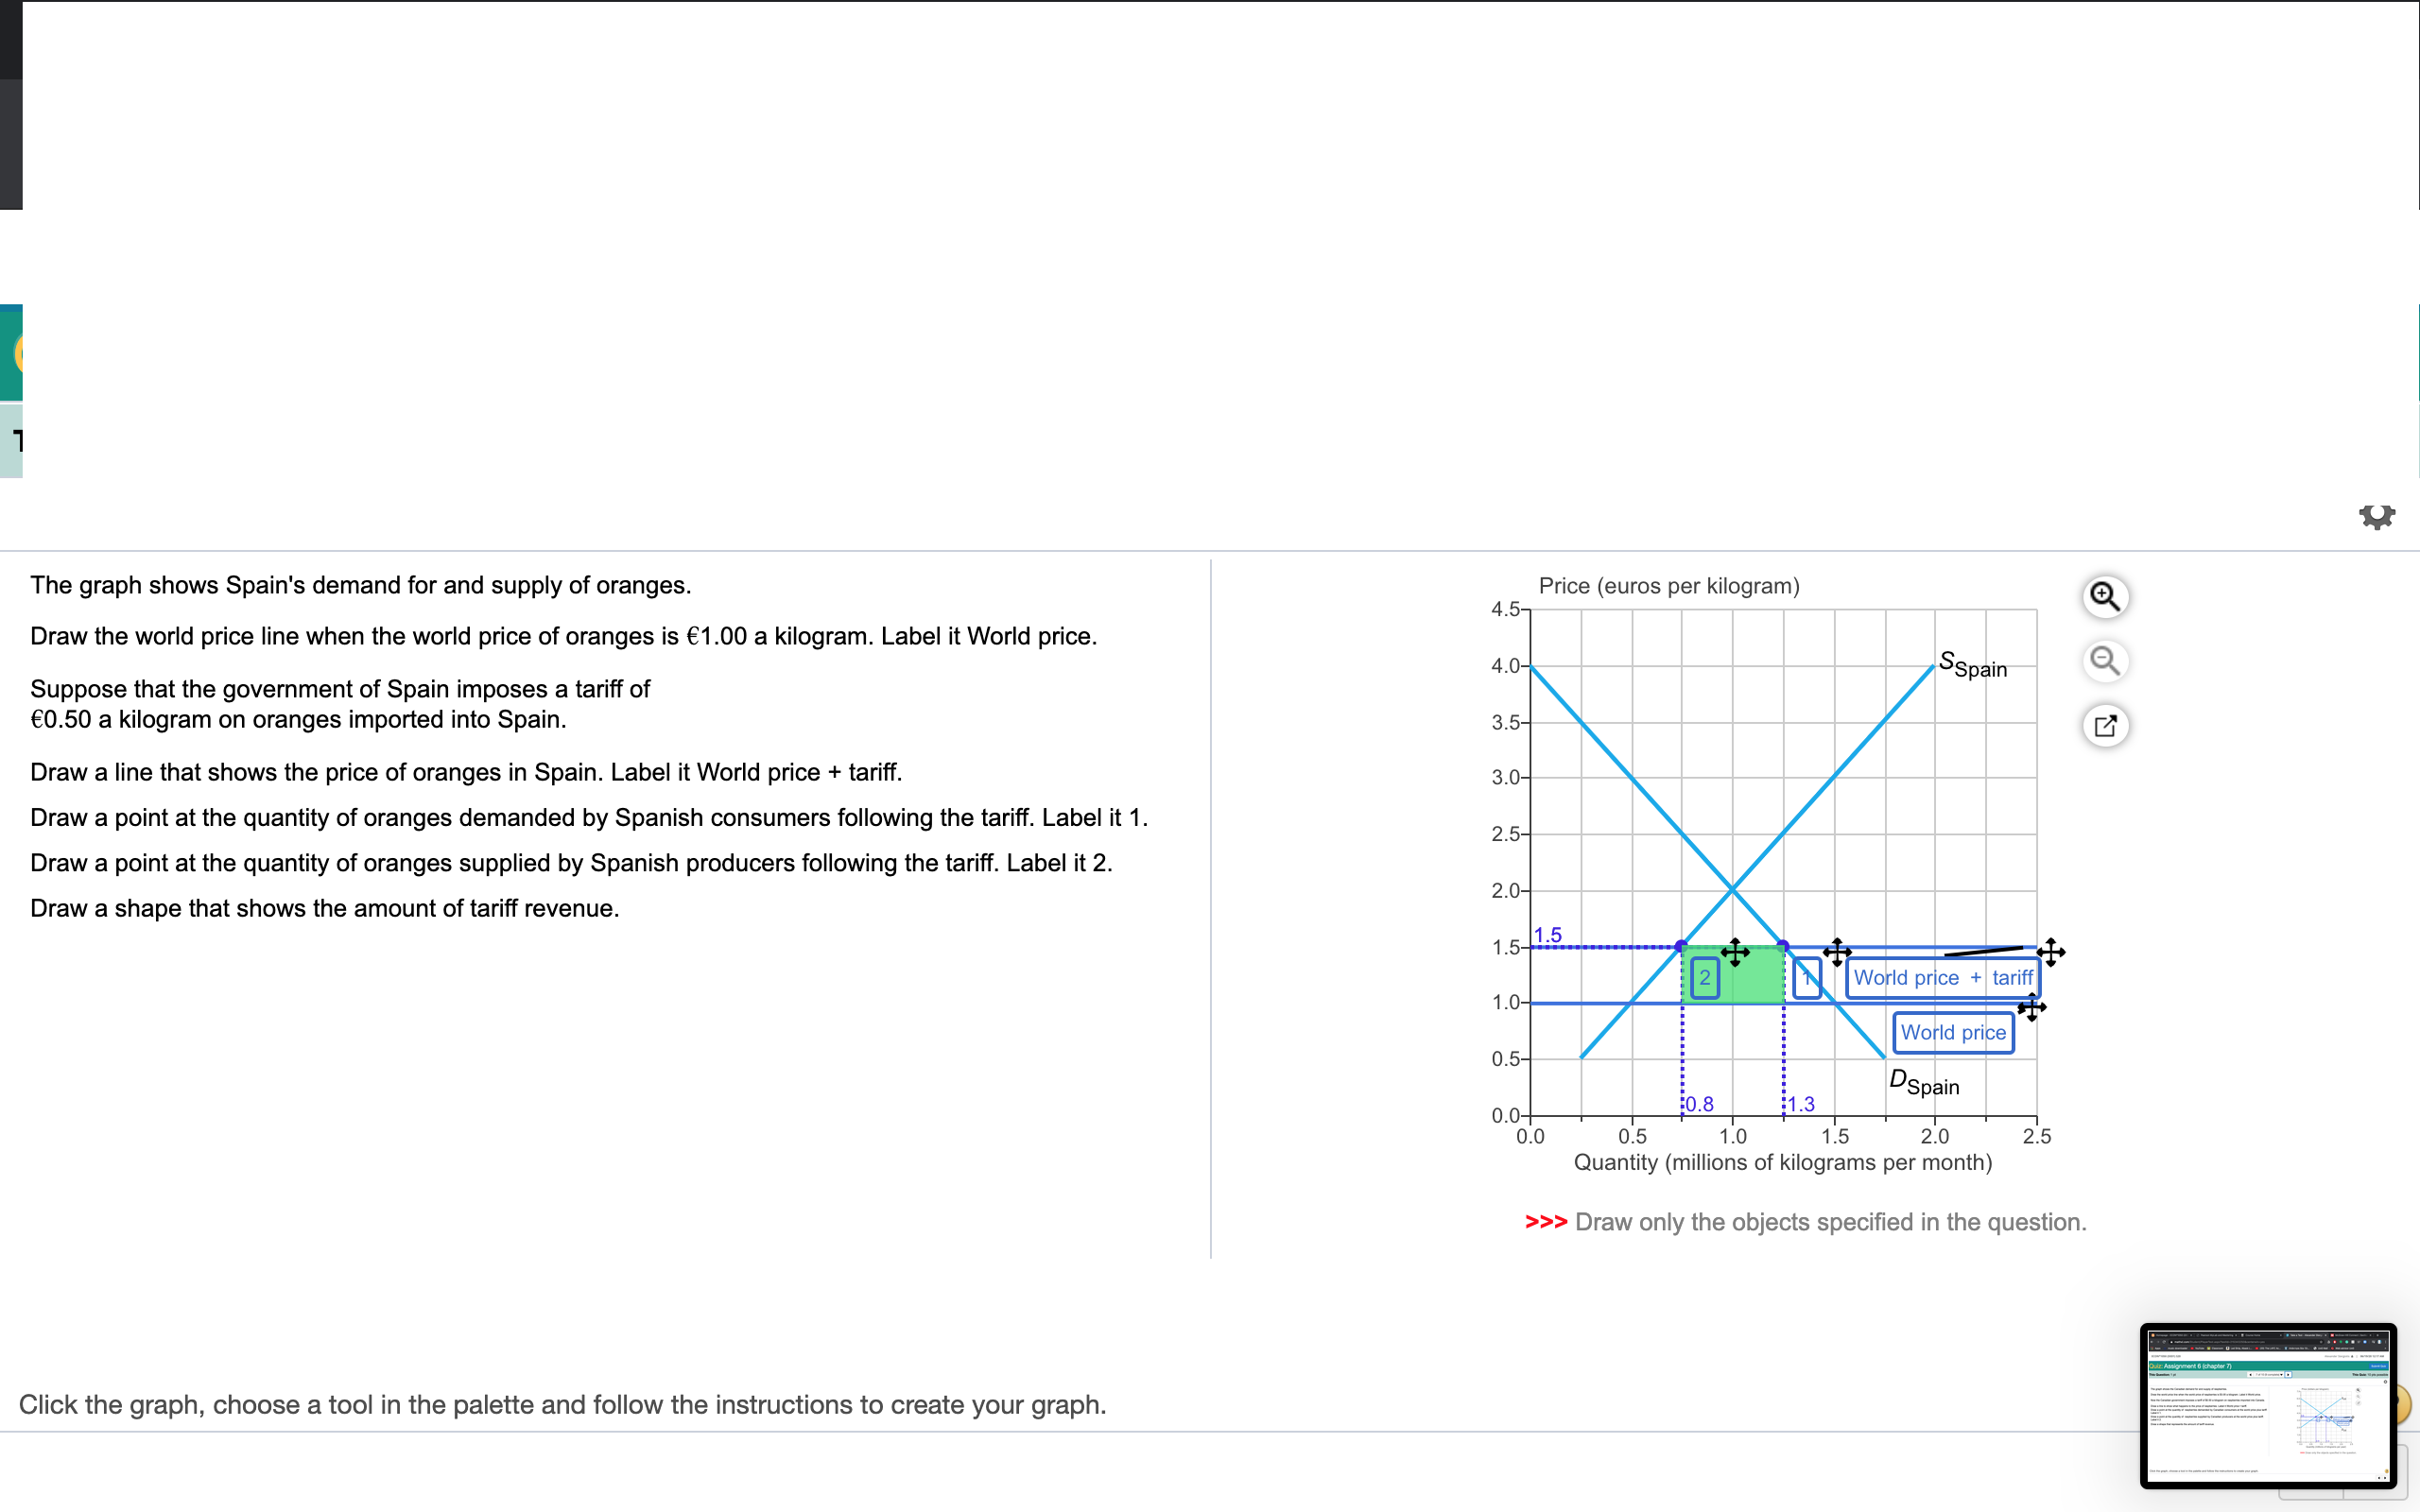
a The graph shows Spain's demand for and supply of oranges. Draw the world price line when the world price of oranges is 1.00 a kilogram. Label it World price. Suppose that the government of Spain imposes a tariff of 0.50 a kilogram on oranges imported into Spain. Draw a line that shows the price of oranges in Spain. Label it World price + tariff. Draw a point at the quantity of oranges demanded by Spanish consumers following the tariff. Label it 1. Draw a point at the quantity of oranges supplied by Spanish producers following the tariff. Label it 2. Draw a shape that shows the amount of tariff revenue. Click the graph, choose a tool in the palette and follow the instructions to create your graph. Price (euros per kilogram) _ . . I . 0.0 0.5 1.0 1,5 210 2.5 Quantity (millions of kilograms per month) >>> Draw only the objects specied in the
Step by Step Solution
There are 3 Steps involved in it

Get step-by-step solutions from verified subject matter experts