

Question: Help on this one please ENVR 1401 - EXERCISE Lab 1 - Math & Environmental Science DIRECTIONS: Use a pencil and ruler for constructing graphs.
Help on this one please

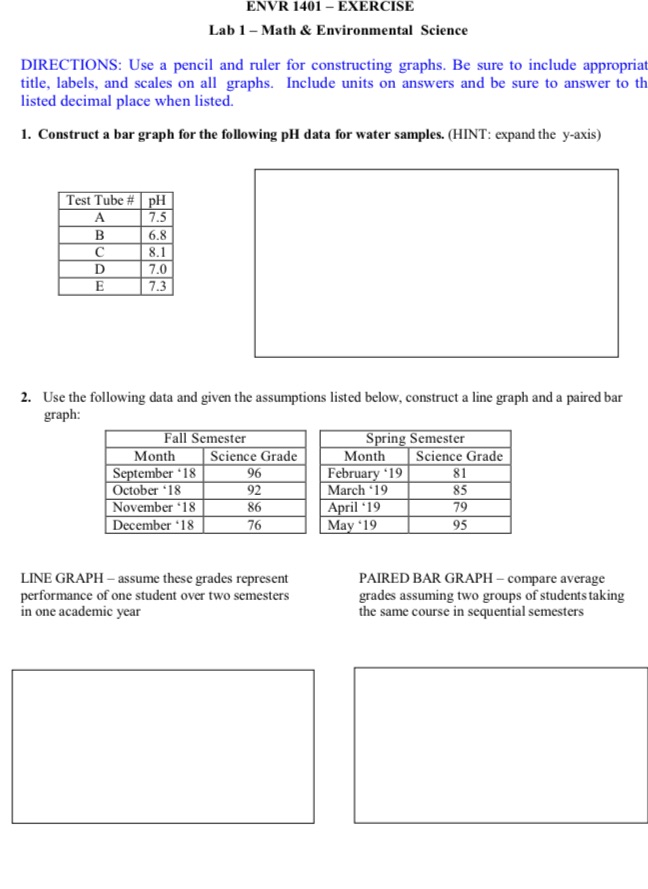
ENVR 1401 - EXERCISE Lab 1 - Math & Environmental Science DIRECTIONS: Use a pencil and ruler for constructing graphs. Be sure to include appropriat title, labels, and scales on all graphs. Include units on answers and be sure to answer to th listed decimal place when listed. 1. Construct a bar graph for the following pl data for water samples. (HINT: expand the y-axis) Test Tube # PH A 7.5 B 6.8 C 8.1 D 7.0 7.3 2. Use the following data and given the assumptions listed below, construct a line graph and a paired bar graph: Fall Semester Spring Semester Month Science Grade Month Science Grade September *18 96 February *19 81 October *18 92 March *19 85 November *18 86 April *19 79 December *18 76 May *19 95 LINE GRAPH - assume these grades represent PAIRED BAR GRAPH - compare average performance of one student over two semesters grades assuming two groups of students taking in one academic year the same course in sequential semesters
Step by Step Solution
There are 3 Steps involved in it

Get step-by-step solutions from verified subject matter experts