

Question: Help! Physics Detailed answers are welcome POSITION v. TIME CHAPTER 2 Position v. Time Constant Velocity Constant Acceleration Position v. Time Time (s) Position (m)
Help! Physics
Detailed answers are welcome
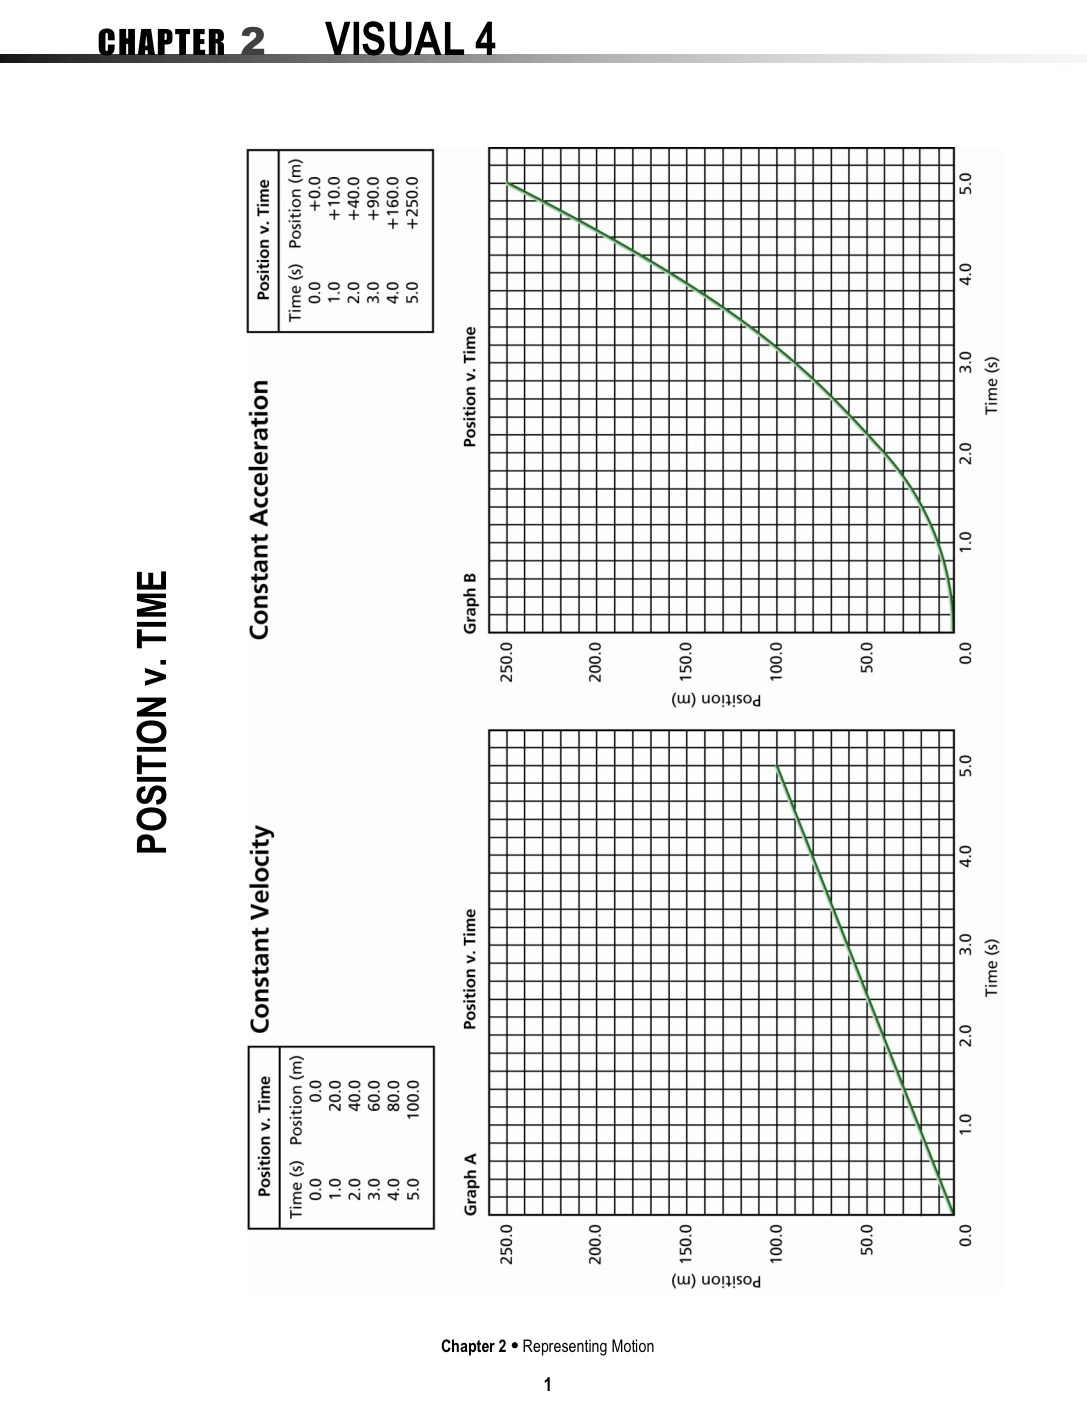
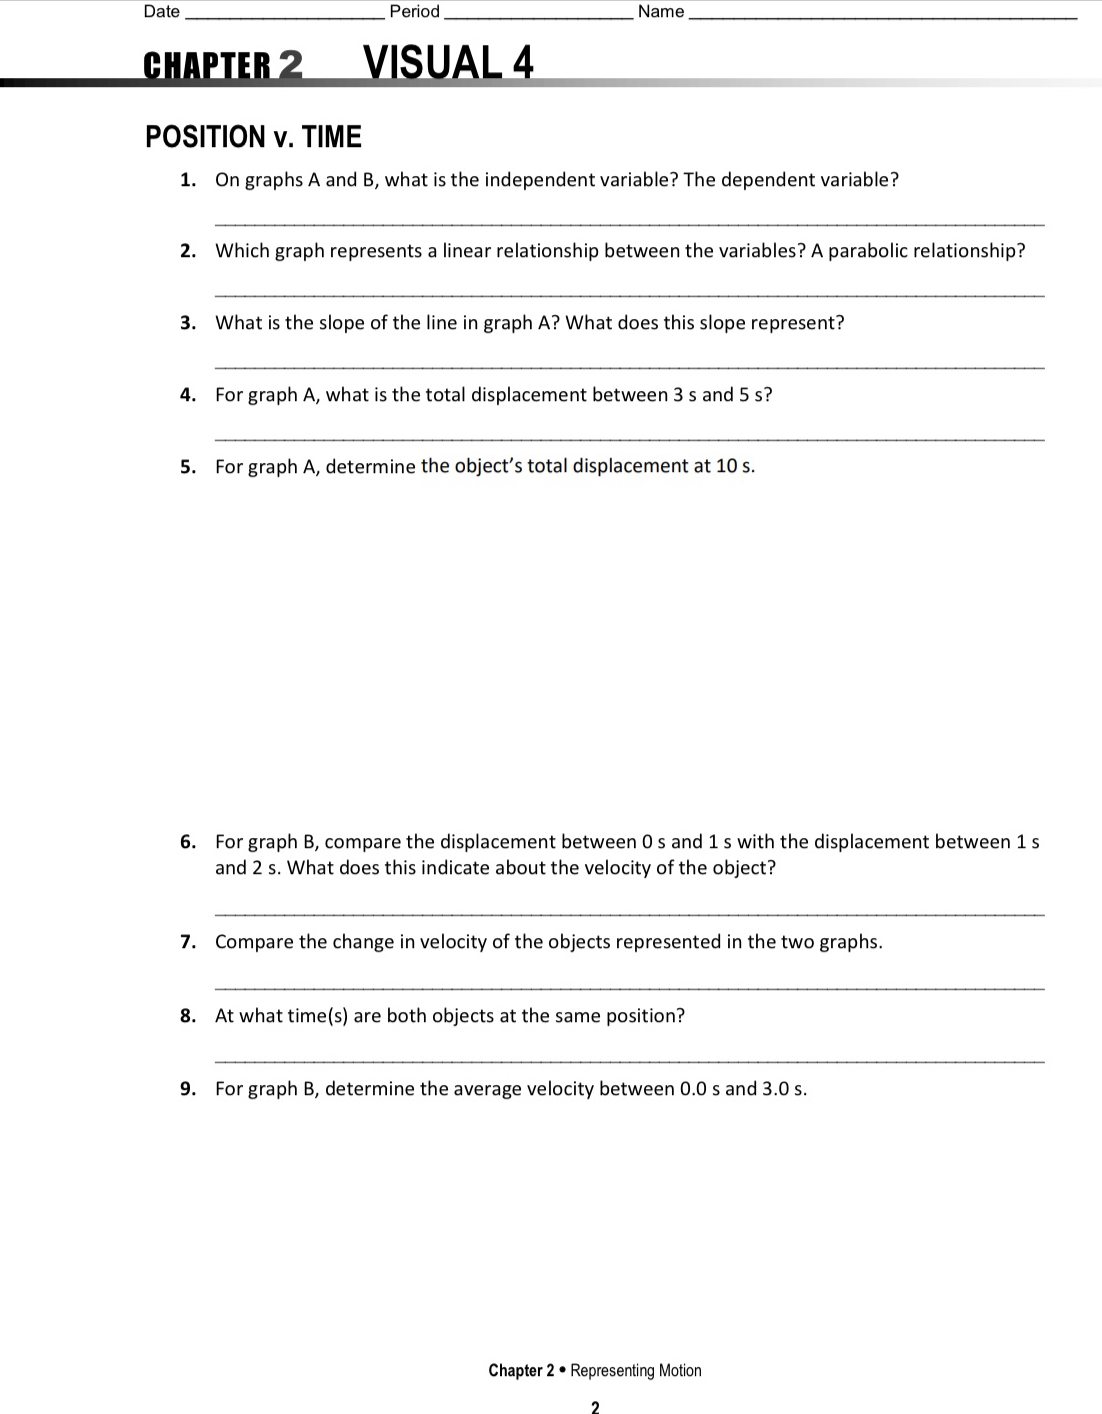
POSITION v. TIME CHAPTER 2 Position v. Time Constant Velocity Constant Acceleration Position v. Time Time (s) Position (m) Time (s) Position (m) 0.0 0.0 0.0 +0.0 1.0 20.0 1.0 +10.0 2.0 40.0 2.0 +40.0 3.0 60.0 3.0 +90.0 4.0 80.0 4.0 + 160.0 100.0 5.0 +250.0 VISUAL 4 Graph A Position v. Time Graph B Position v. Time 250.0 250.0 Chapter 2 . Representing Motion 200.0 200.0 150.0 150.0 Position (m) Position (m) 100.0 100.0 50.0 50.0 0.0 1.0 2.0 3.0 4.0 5.0 0.0 10 2.0 3.0 4.0 Time (s) Time (s)Date Period Name __cum:n2_\\LIuALA__ POSITION V. TIME 1. 0n graphs A and 8, what is the independent variable? The dependent variable? 2. Which graph represents a linear relationship between the variables? A parabolic relationship? 3. What is the slope of the line in graph A? What does this slope represent? 4. For graph A, what is the total displacement between 3 s and 5 s? 5. For graph A, determine the object's total displacement at 10 s. 6. For graph B, compare the displacement between 0 s and 1 s with the displacement between 1 s and 2 5. What does this indicate about the velocitv of the object? 7. Compare the change in velocity of the objects represented in the two graphs. 8. At what time(s) are both objects at the same position? 9. For graph B, determine the average velocity between 0.0 s and 3.0 5. Chapter 2 0 Representing Motion 2
Step by Step Solution
There are 3 Steps involved in it

Get step-by-step solutions from verified subject matter experts