

Question: help please:( 105 points in Total ( 5 points bonus) Part A 1. The short paragraph that explains the reason for an organization's existence is
help please:( 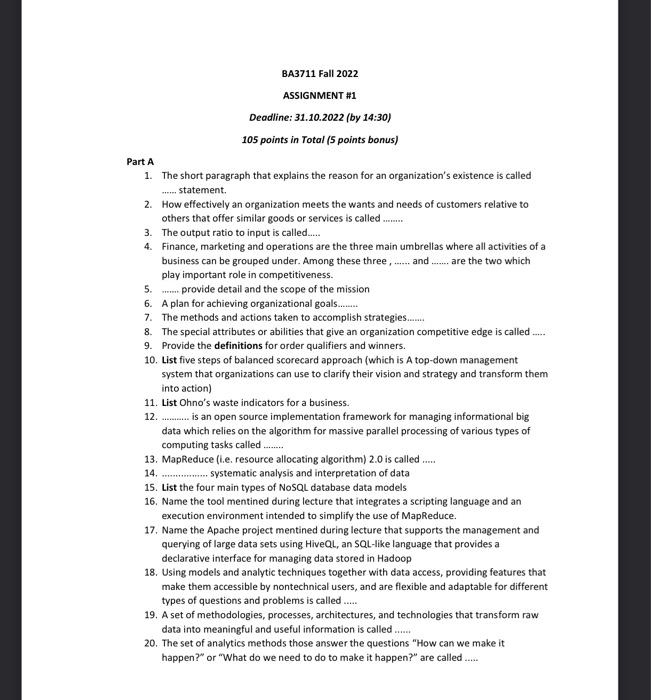
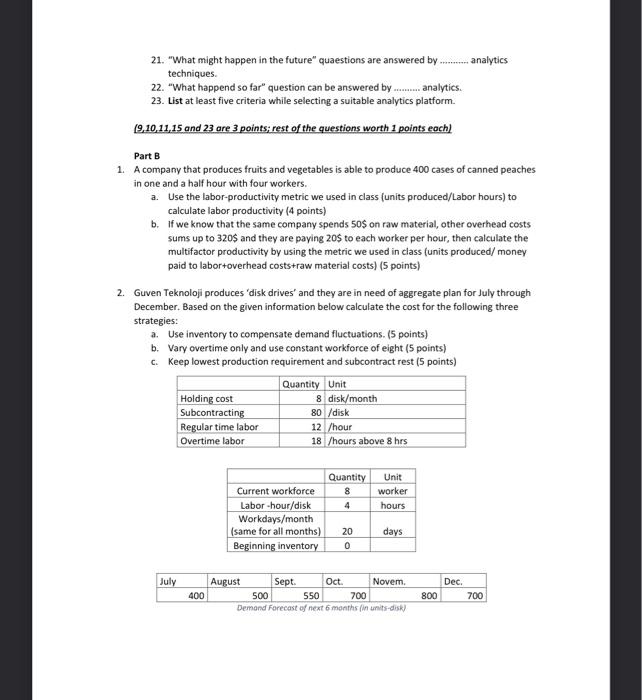
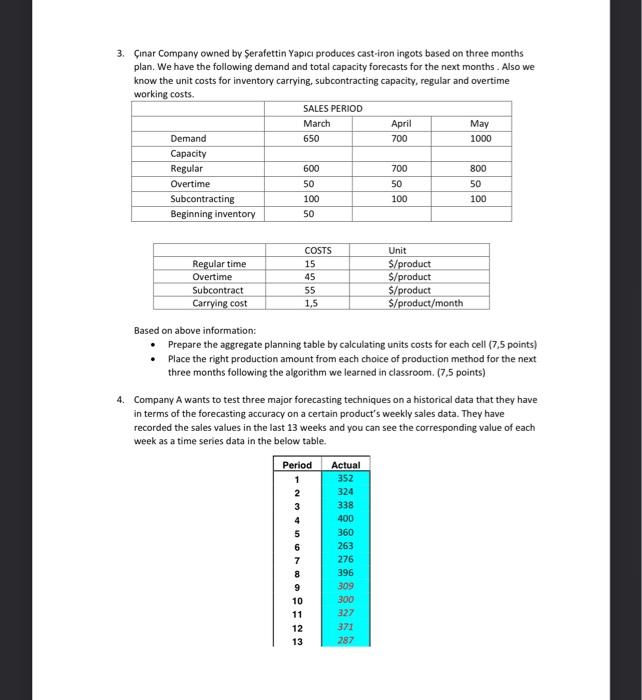
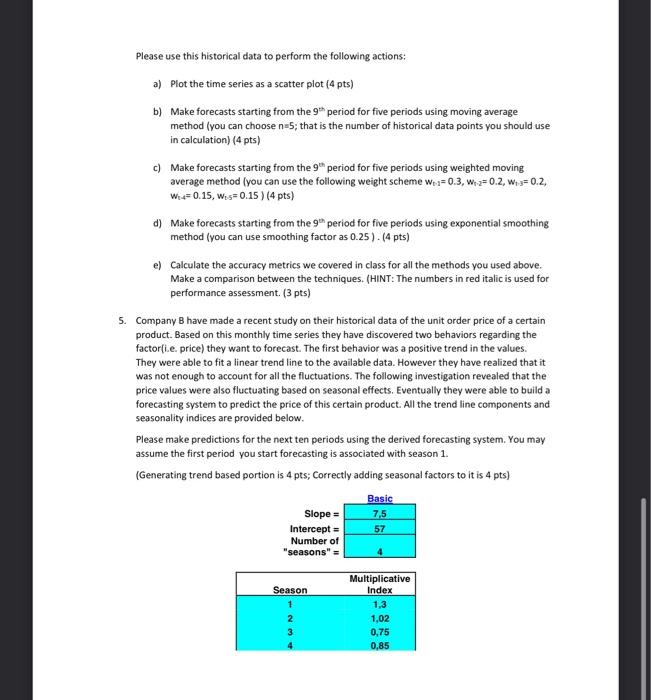

105 points in Total ( 5 points bonus) Part A 1. The short paragraph that explains the reason for an organization's existence is called statement. 2. How effectively an organization meets the wants and needs of customers relative to others that offer similar goods or services is called ....... 3. The output ratio to input is called.... 4. Finance, marketing and operations are the three main umbrellas where all activities of a business can be grouped under. Among these three, ...... and ....... are the two which play important role in competitiveness. 5. ...... provide detail and the scope of the mission 6. A plan for achieving organizational goals....... 7. The methods and actions taken to accomplish strategies.... 8. The special attributes or abilities that give an organization competitive edge is called .... 9. Provide the definitions for order qualifiers and winners. 10. List five steps of balanced scorecard approach (which is A top-down management system that organizations can use to clarify their vision and strategy and transform them into action) 11. List Ohno's waste indicators for a business. 12. .......... is an open source implementation framework for managing informational big data which relies on the algorithm for massive parallel processing of various types of computing tasks called........ 13. MapReduce (i.e. resource allocating algorithm) 2.0 is called ..... 14. ............. systematic analysis and interpretation of data 15. List the four main types of NoSQL database data models 16. Name the tool mentined during lecture that integrates a scripting language and an execution environment intended to simplify the use of MapReduce. 17. Name the Apache project mentined during lecture that supports the management and querying of large data sets using HiveQL, an SQL-like language that provides a declarative interface for managing data stored in Hadoop 18. Using models and analytic techniques together with data access, providing features that make them accessible by nontechnical users, and are flexible and adaptable for different types of questions and problems is called ..... 19. A set of methodologies, processes, architectures, and technologies that transform raw data into meaningful and useful information is called ..... 20. The set of analytics methods those answer the questions "How can we make it happen?" or "What do we need to do to make it happen?" are called...... 21. "What might happen in the future" quaestions are answered by analytics techniques. 22. "What happend so far" question can be answered by ....s... analytics. 23. List at least five criteria while selecting a suitable analytics platform. {9,10,11,15 and 23 are 3 points; rest of the questions worth 1 points each) Part B 1. A company that produces fruits and vegetables is able to produce 400 cases of canned peaches in one and a half hour with four workers. a. Use the labor-productivity metric we used in class (units produced/Labor hours) to calculate labor productivity ( 4 points) b. If we know that the same company spends 50$ on raw material, other overhead costs sums up to 320$ and they are paying 20$ to each worker per hour, then calculate the multifactor productivity by using the metric we used in class (units produced/ money paid to labortoverhead costs+raw material costs) (5 points) 2. Guven Teknoloji produces 'disk drives' and they are in need of aggregate plan for July through December. Based on the given information below calculate the cost for the following three strategies: a. Use inventory to compensate demand fluctuations. (5 points) b. Vary overtime only and use constant workforce of eight (5 points) c. Keep lowest production requirement and subcontract rest ( 5 points) 3. Cinar Company owned by Serafettin Yapici produces cast-iron ingots based on three months plan. We have the following demand and total capacity forecasts for the next months. Also we know the unit costs for inventory carrying, subcontracting capacity, regular and overtime working costs. Based on above information: - Prepare the aggregate planning table by calculating units costs for each cell (7,5 points) - Place the right production amount from each choice of production method for the next three months following the algorithm we learned in classroom. (7,5 points) 4. Company A wants to test three major forecasting techniques on a historical data that they have in terms of the forecasting accuracy on a certain product's weekly sales data. They have recorded the sales values in the last 13 weeks and you can see the corresponding value of each week as a time series data in the below table. Please use this historical data to perform the following actions: a) Plot the time series as a scatter plot ( 4 pts) b) Make forecasts starting from the 9th period for five periods using moving average method (you can choose n=5; that is the number of historical data points you should use in calculation) (4 pts) c) Make forecasts starting from the 9th period for five periods using weighted moving average method (you can use the following weight scheme wt:1=0.3,w1.2=0.2,w1.3=0.2, wt4=0.15,wt.5=0.15)(4pts) d) Make forecasts starting from the 9th period for five periods using exponential smoothing method (you can use smoothing factor as 0.25) ) (4 pts) e) Calculate the accuracy metrics we covered in class for all the methods you used above. Make a comparison between the techniques. (HINT: The numbers in red italic is used for performance assessment. (3 pts) 5. Company B have made a recent study on their historical data of the unit order price of a certain product. Based on this monthly time series they have discovered two behaviors regarding the factor(i.e. price) they want to forecast. The first behavior was a positive trend in the values. They were able to fit a linear trend line to the available data. However they have realized that it was not enough to account for all the fluctuations. The following investigation revealed that the price values were also fluctuating based on seasonal effects. Eventually they were able to build a forecasting system to predict the price of this certain product. All the trend line components and seasonality indices are provided below. Please make predictions for the next ten periods using the derived forecasting system. You may assume the first period you start forecasting is associated with season 1 . (Generating trend based portion is 4 pts; Correctly adding seasonal factors to it is 4 pts) HINT: - You can use the excel template that we used during the class and saved inside resources of 901 in Itslearning. (Make sure you understand the calculations for written exam toughl
Step by Step Solution
There are 3 Steps involved in it
1 Expert Approved Answer
Step: 1 Unlock

Question Has Been Solved by an Expert!
Get step-by-step solutions from verified subject matter experts
Step: 2 Unlock
Step: 3 Unlock