

Question: help please 15. The mean waiting time at the drivethrough of a fast-food restaurant from the time an order is placed to the time the
help please
15.
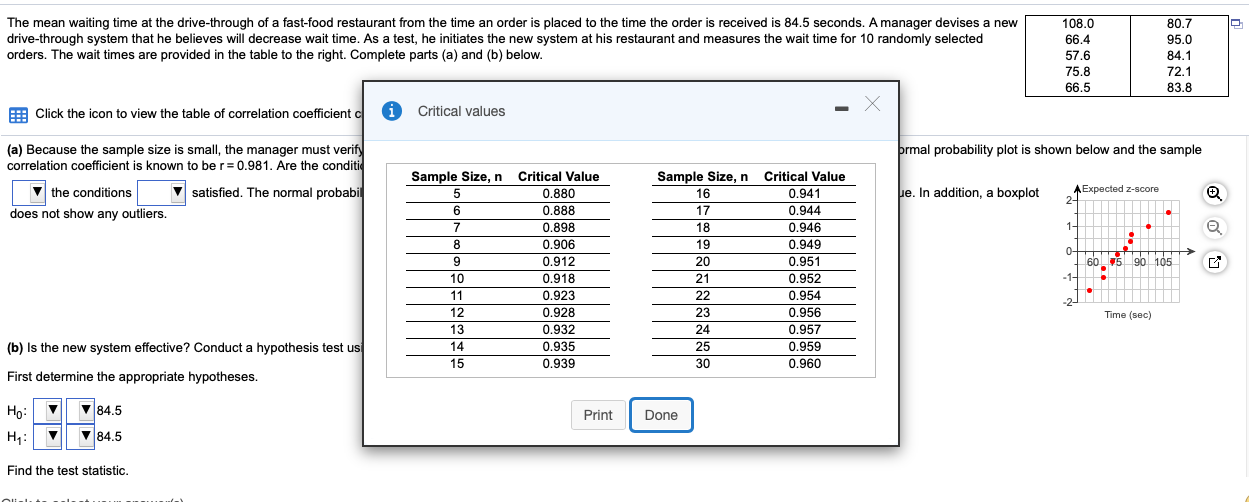
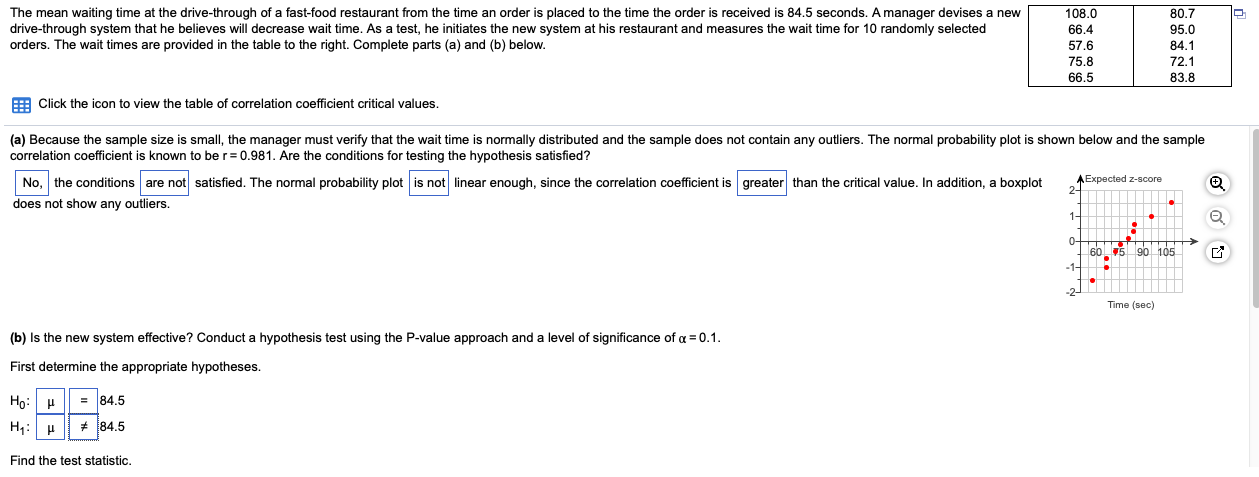
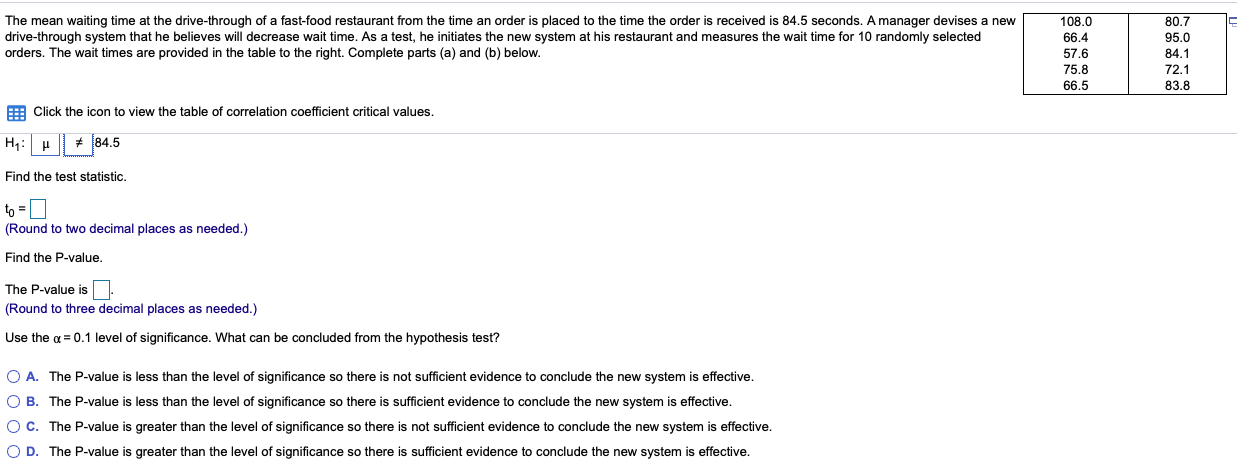
The mean waiting time at the drivethrough of a fast-food restaurant from the time an order is placed to the time the order is received is 84.5 seconds. A manager devises a new dive-through system that he believes will decrease wait time. As a test, he initiates the new system at his restaurant and measures the wait the for 10 rmdomly selected orders. The wait lines are provided in the table to the right. Complete parts {a} and (bi below. Clickthe icon to viewthe table at correlation coefcient - 0 lecal values (a) Because the sample size is small, the manager must correlation ceetficient is known to be r = 0.931. Are the and Sample Size. n Critical Value Sample Size. n Critical Value 7 the conditions " sat'ed. The nom'lal probahi 5 0.880 16 [L941 does not show any culliers. 5 0333 17 0344 ? 0.393 13 0.946 B 0.906 19 0.949 9 0.912 20 0.951 10 0.913 21 0.952 11 0.923 22 0.954 12 0.923 23 0.956 13 0.932 24 0.957 {b} Is the new system effective? Conduct a hypothesis test -. 14 0.935 25 0.959 15 0.939 30 0.960 First determine the appropriate hypotheses. Ho: 1' V 84.5 H1: Y Y 34.5 Find the test statistic. rm... ._ __.__. ......_ ___..._..._\\ 103.0 66.4 57.6 75.3 66.5 30.7 95.0 34.1 12.1 33.3 The mean waiting time at the drive-through of a fast-food restaurant from the time an order is placed to the time the order is received is 84.5 seconds. A manager devises a new 108.0 80.7 drive-through system that he believes will decrease wait time. As a test, he initiates the new system at his restaurant and measures the wait time for 10 randomly selected 66.4 95.0 orders. The wait times are provided in the table to the right. Complete parts (a) and (b) below. 57.6 84.1 75.8 72.1 66.5 83.8 Click the icon to view the table of correlation coefficient critical values. (a) Because the sample size is small, the manager must verify that the wait time is normally distributed and the sample does not contain any outliers. The normal probability plot is shown below and the sample correlation coefficient is known to be r= 0.981. Are the conditions for testing the hypothesis satisfied? No, the conditions are not satisfied. The normal probability plot is not linear enough, since the correlation coefficient is greater than the critical value. In addition, a boxplot AExpected z-score does not show any outliers. 60 90 105 Time (sec) (b) Is the new system effective? Conduct a hypothesis test using the P-value approach and a level of significance of a = 0.1. First determine the appropriate hypotheses. Ho 84.5 H1: # 84.5 Find the test statistic.The mean waiting time at the drive-through of a fast-food restaurant from the time an order is placed to the time the order is received is 84.5 seconds. A manager devises a new 108.0 80.7 drive-through system that he believes will decrease wait time. As a test, he initiates the new system at his restaurant and measures the wait time for 10 randomly selected 66.4 95.0 orders. The wait times are provided in the table to the right. Complete parts (a) and (b) below. 57.6 84.1 75.8 72.1 66.5 83.8 Click the icon to view the table of correlation coefficient critical values. Hy : # 84.5 Find the test statistic. to =] (Round to two decimal places as needed.) Find the P-value. The P-value is. (Round to three decimal places as needed.) Use the a = 0.1 level of significance. What can be concluded from the hypothesis test? O A. The P-value is less than the level of significance so there is not sufficient evidence to conclude the new system is effective. O B. The P-value is less than the level of significance so there is sufficient evidence to conclude the new system is effective. O C. The P-value is greater than the level of significance so there is not sufficient evidence to conclude the new system is effective. O D. The P-value is greater than the level of significance so there is sufficient evidence to conclude the new system is effective
Step by Step Solution
There are 3 Steps involved in it

Get step-by-step solutions from verified subject matter experts