

Question: HELP PLEASE ? 9-18 is a data matrix that displays the frequency of some combination of possible responses to multiple variables. O a. Marginals O
HELP PLEASE ? 9-18

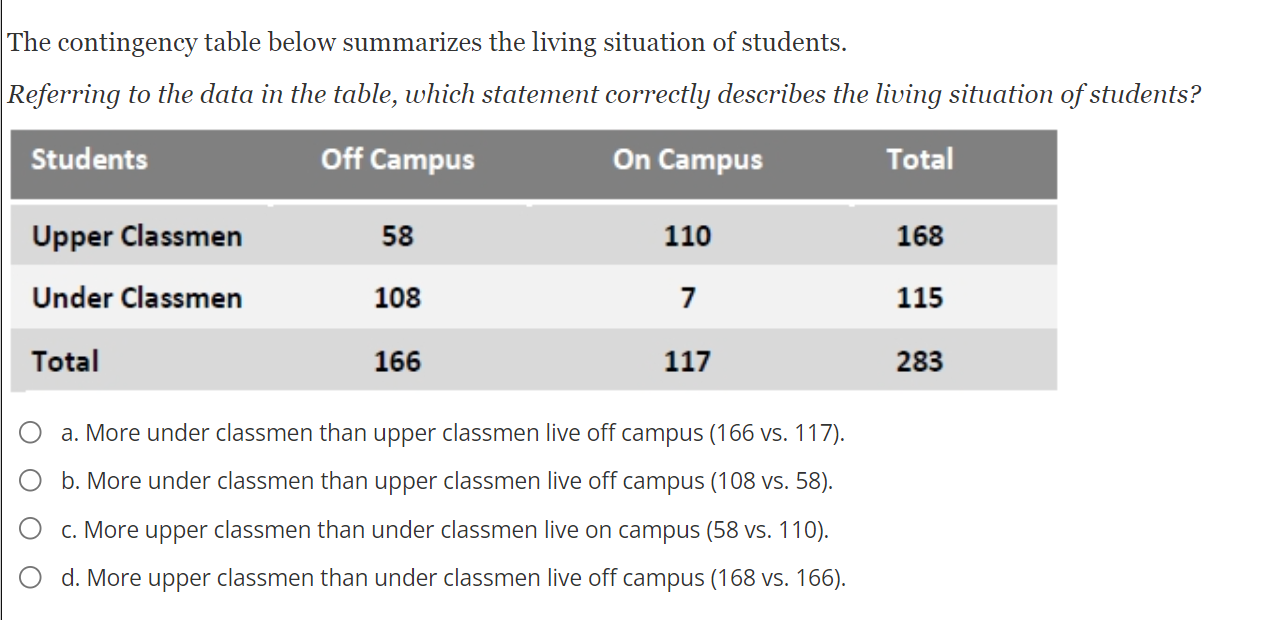
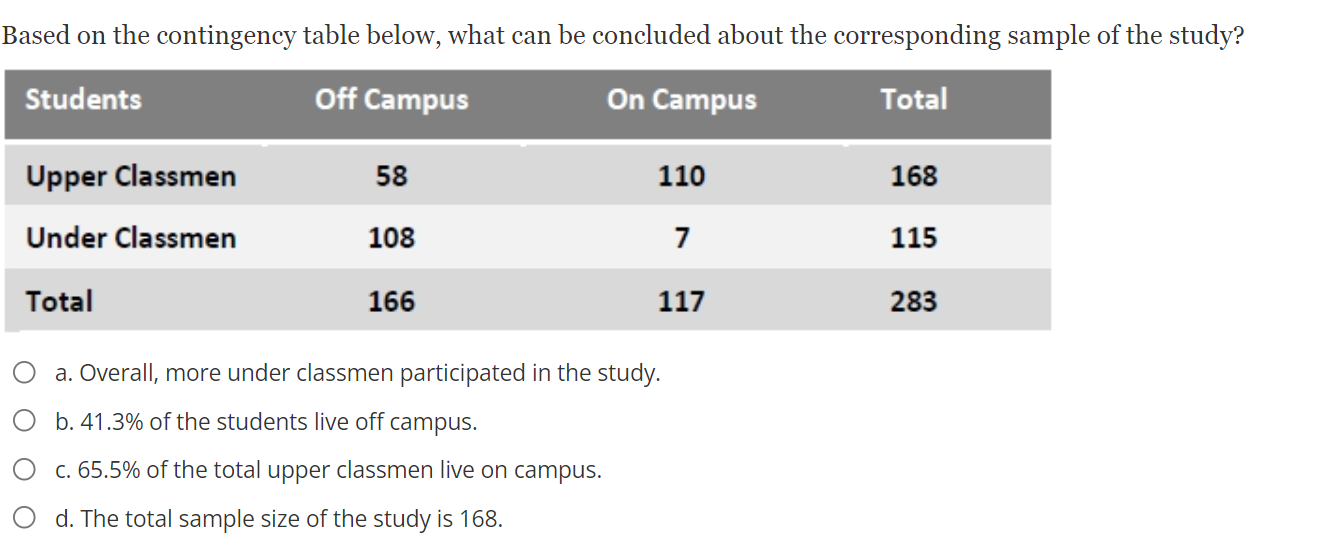
is a data matrix that displays the frequency of some combination of possible responses to multiple variables. O a. Marginals O b. Histogram O c. Contingency table O d. Frequency tableThe contingency table below summarizes the living situation of students. Referring to the data in the table, which statement correctly describes the living situation of students? Students Off Campus On Campus Total Upper Gasman 58 110 168 Under Classmen 108 7 115 Total 166 117 233 O a. More under classmen than upper classmen live off campus (1 66 vs. 117}. O b. More under classmen than upper classmen live off campus (1 08 vs. 58). O c. More upper classmen than under classmen live on campus (58 vs. 110). Q d. More upper Classmen than under classmen live off campus (1 68 vs. 166). Based on the contingency table below, what can be concluded about the corresponding sample of the study? Students Off Campus On Campus Total Upper (lumen 58 110 168 Under Classman 108 7 115 Total 166 117 283 O a. Overall, more under classmen participated in the study. 0 b. 41.3% of the students live off campus. 0 c. 65.5% of the total upper classmen live on campus. 0 cl. The total sample size of the study is 168. A researcher is conducting a study on shopping behavior and is interested in determining differences based on gender. Once a cross-tabulate has been created to determine if more women or men go shopping at Whole Foods, the research decides to look at an additional variable: green behavior Results show that while overall more women than men go shopping at Whole Foods, adding green behavior does not show this gender effect since both groups express the same frequency of shopping at the store. What type of analysis did the researcher implement? O a. Median split O b. Significance level O c. Elaboration analysis O d. Data transformationA new research study is trying to understand how undergraduate students utilize textbooks. Results of previous studies have shown that publishers believe students prefer online textbooks, while edueators believe students still prefer printed textbooks if they buy textbooks at all. Since undergraduate students are usually very close in age, the researchers decide not to create age groups and instead ask an open ended question to assess respondents age. Once the data is collected, the researcher can create a grouping variable based on the age distribution of the sarnple. Mat is the process called that researchers will implement to change the data by creating a grouping variable? 0 a Data elaboration b. Data transformation cs Statistical base 000 d. Data transferal When is it most appropriate for a researcher to conduct a median split? 0 a. When the data is normally distributed. b. When the sample size is over 100. c. When the data has a bimodal distribution. 000 d. When multiple items assess the same construct. Researchers use to tests hypotheses involving only one variable and draw inferences about that single variable. 0 a. Multiple statistical analysis 0 b. Single statistical analysis 0 c. Bivariate statistical analysis 0 cl. Univa riate statistical analysis What is the variable being investigated in the hypothesis stated below? H1: The average number of hours consumers write reviews online per week is greater than 2.5 hours/week. O a. Number of hours consumers write online reviews 0 b. Consumers O c. Greater than 2.5 Q d. Average numbers of hours
Step by Step Solution
There are 3 Steps involved in it

Get step-by-step solutions from verified subject matter experts