

Question: help please A random sample of n, = 10 regions in New England gave the following violent crime rates (per million population). x,: New England
help please
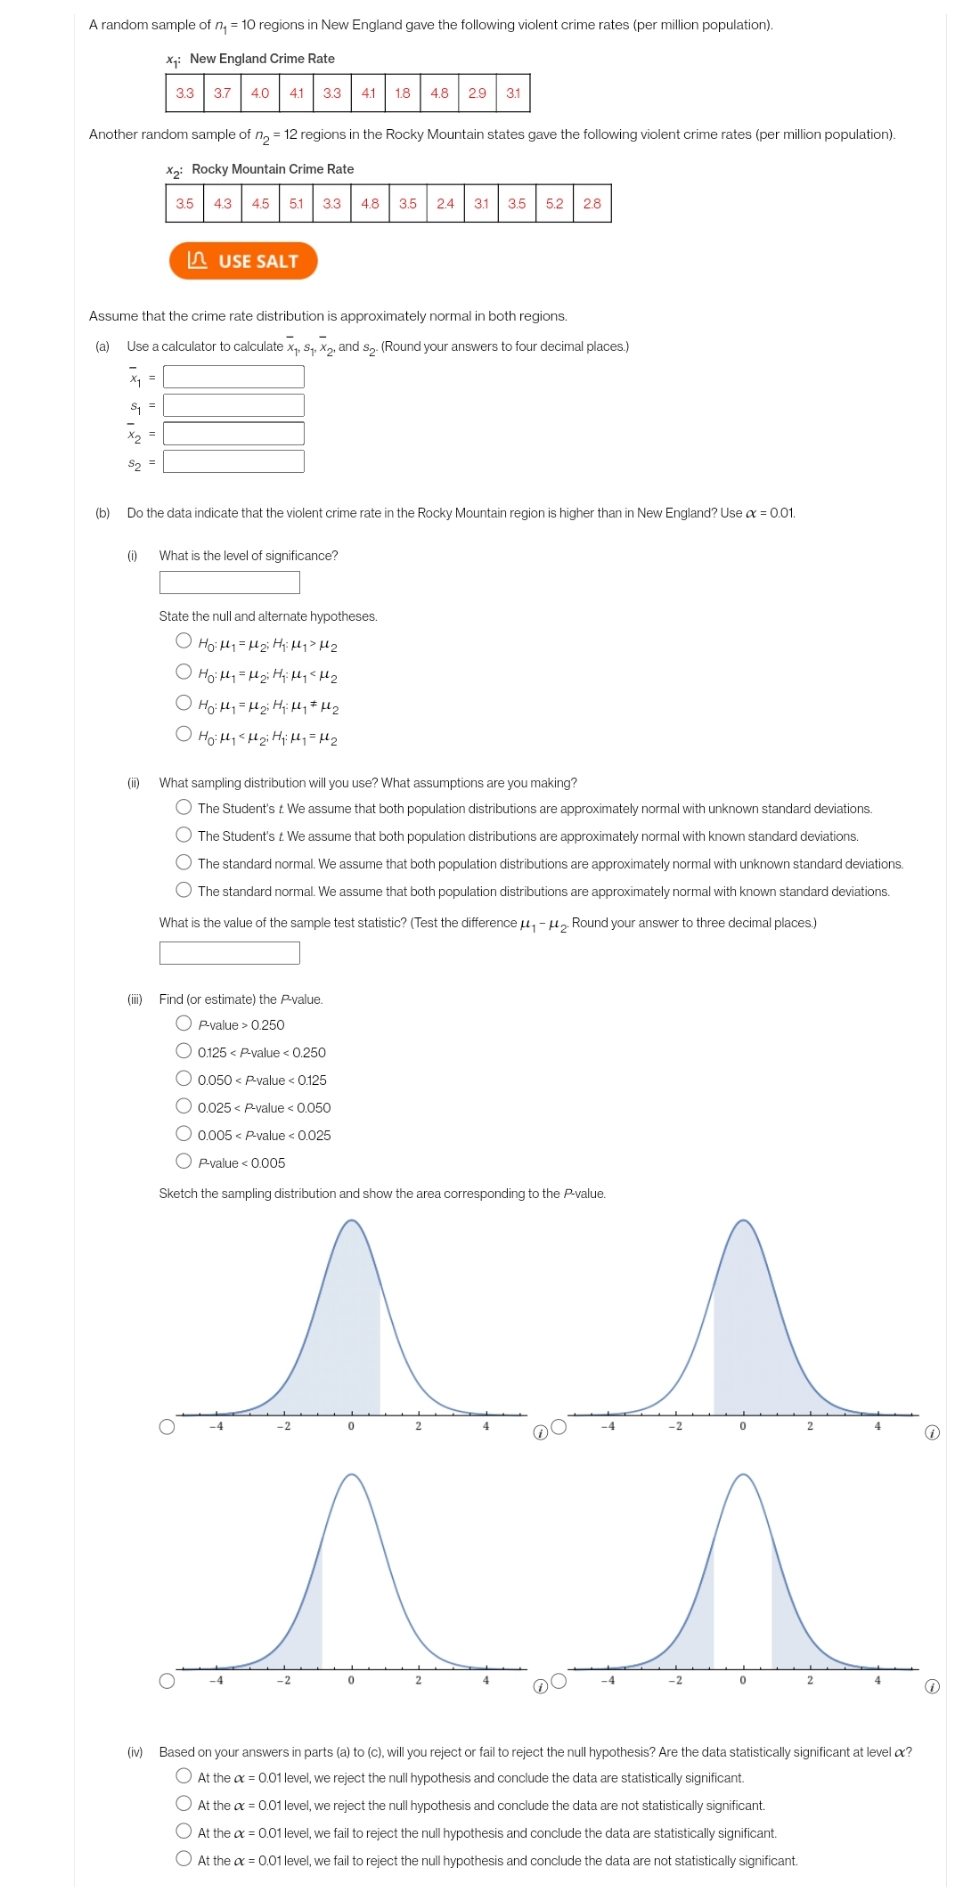
A random sample of n, = 10 regions in New England gave the following violent crime rates (per million population). x,: New England Crime Rate 3.3 3.7 4.0 4.1 3.3 4.1 1.8 4.8 2.9 3.1 Another random sample of n, = 12 regions in the Rocky Mountain states gave the following violent crime rates (per million population). *2: Rocky Mountain Crime Rate 3.5 4.3 4.5 5.1 3.3 4.8 3.5 2.4 3.1 3.5 5.2 28 LA USE SALT Assume that the crime rate distribution is approximately normal in both regions. (a) Use a calculator to calculate x1. S,, X2, and $2- (Round your answers to four decimal places.) S1 So (b) Do the data indicate that the violent crime rate in the Rocky Mountain region is higher than in New England? Use o = 0.01. What is the level of significance? State the null and alternate hypotheses. O HO:My = 12:H : 1 1 > H2 (ii) What sampling distribution will you use? What assumptions are you making? The Student's t. We assume that both population distributions are approximately normal with unknown standard deviations. The Student's t We assume that both population distributions are approximately normal with known standard deviations. The standard normal. We assume that both population distributions are approximately normal with unknown standard deviations. The standard normal. We assume that both population distributions are approximately normal with known standard deviations. What is the value of the sample test statistic? (Test the difference , - H2 Round your answer to three decimal places.) (i) Find (or estimate) the P-value. O Pvalue > 0.250 O 0.125
Step by Step Solution
There are 3 Steps involved in it

Get step-by-step solutions from verified subject matter experts