

Question: help please AutoSave OFF 9 06 ... w- Midterm #1 Spring, 2021 Biostatistics 100A - Compatibility Mode - Saved to my Mac Home Insert Draw
help please
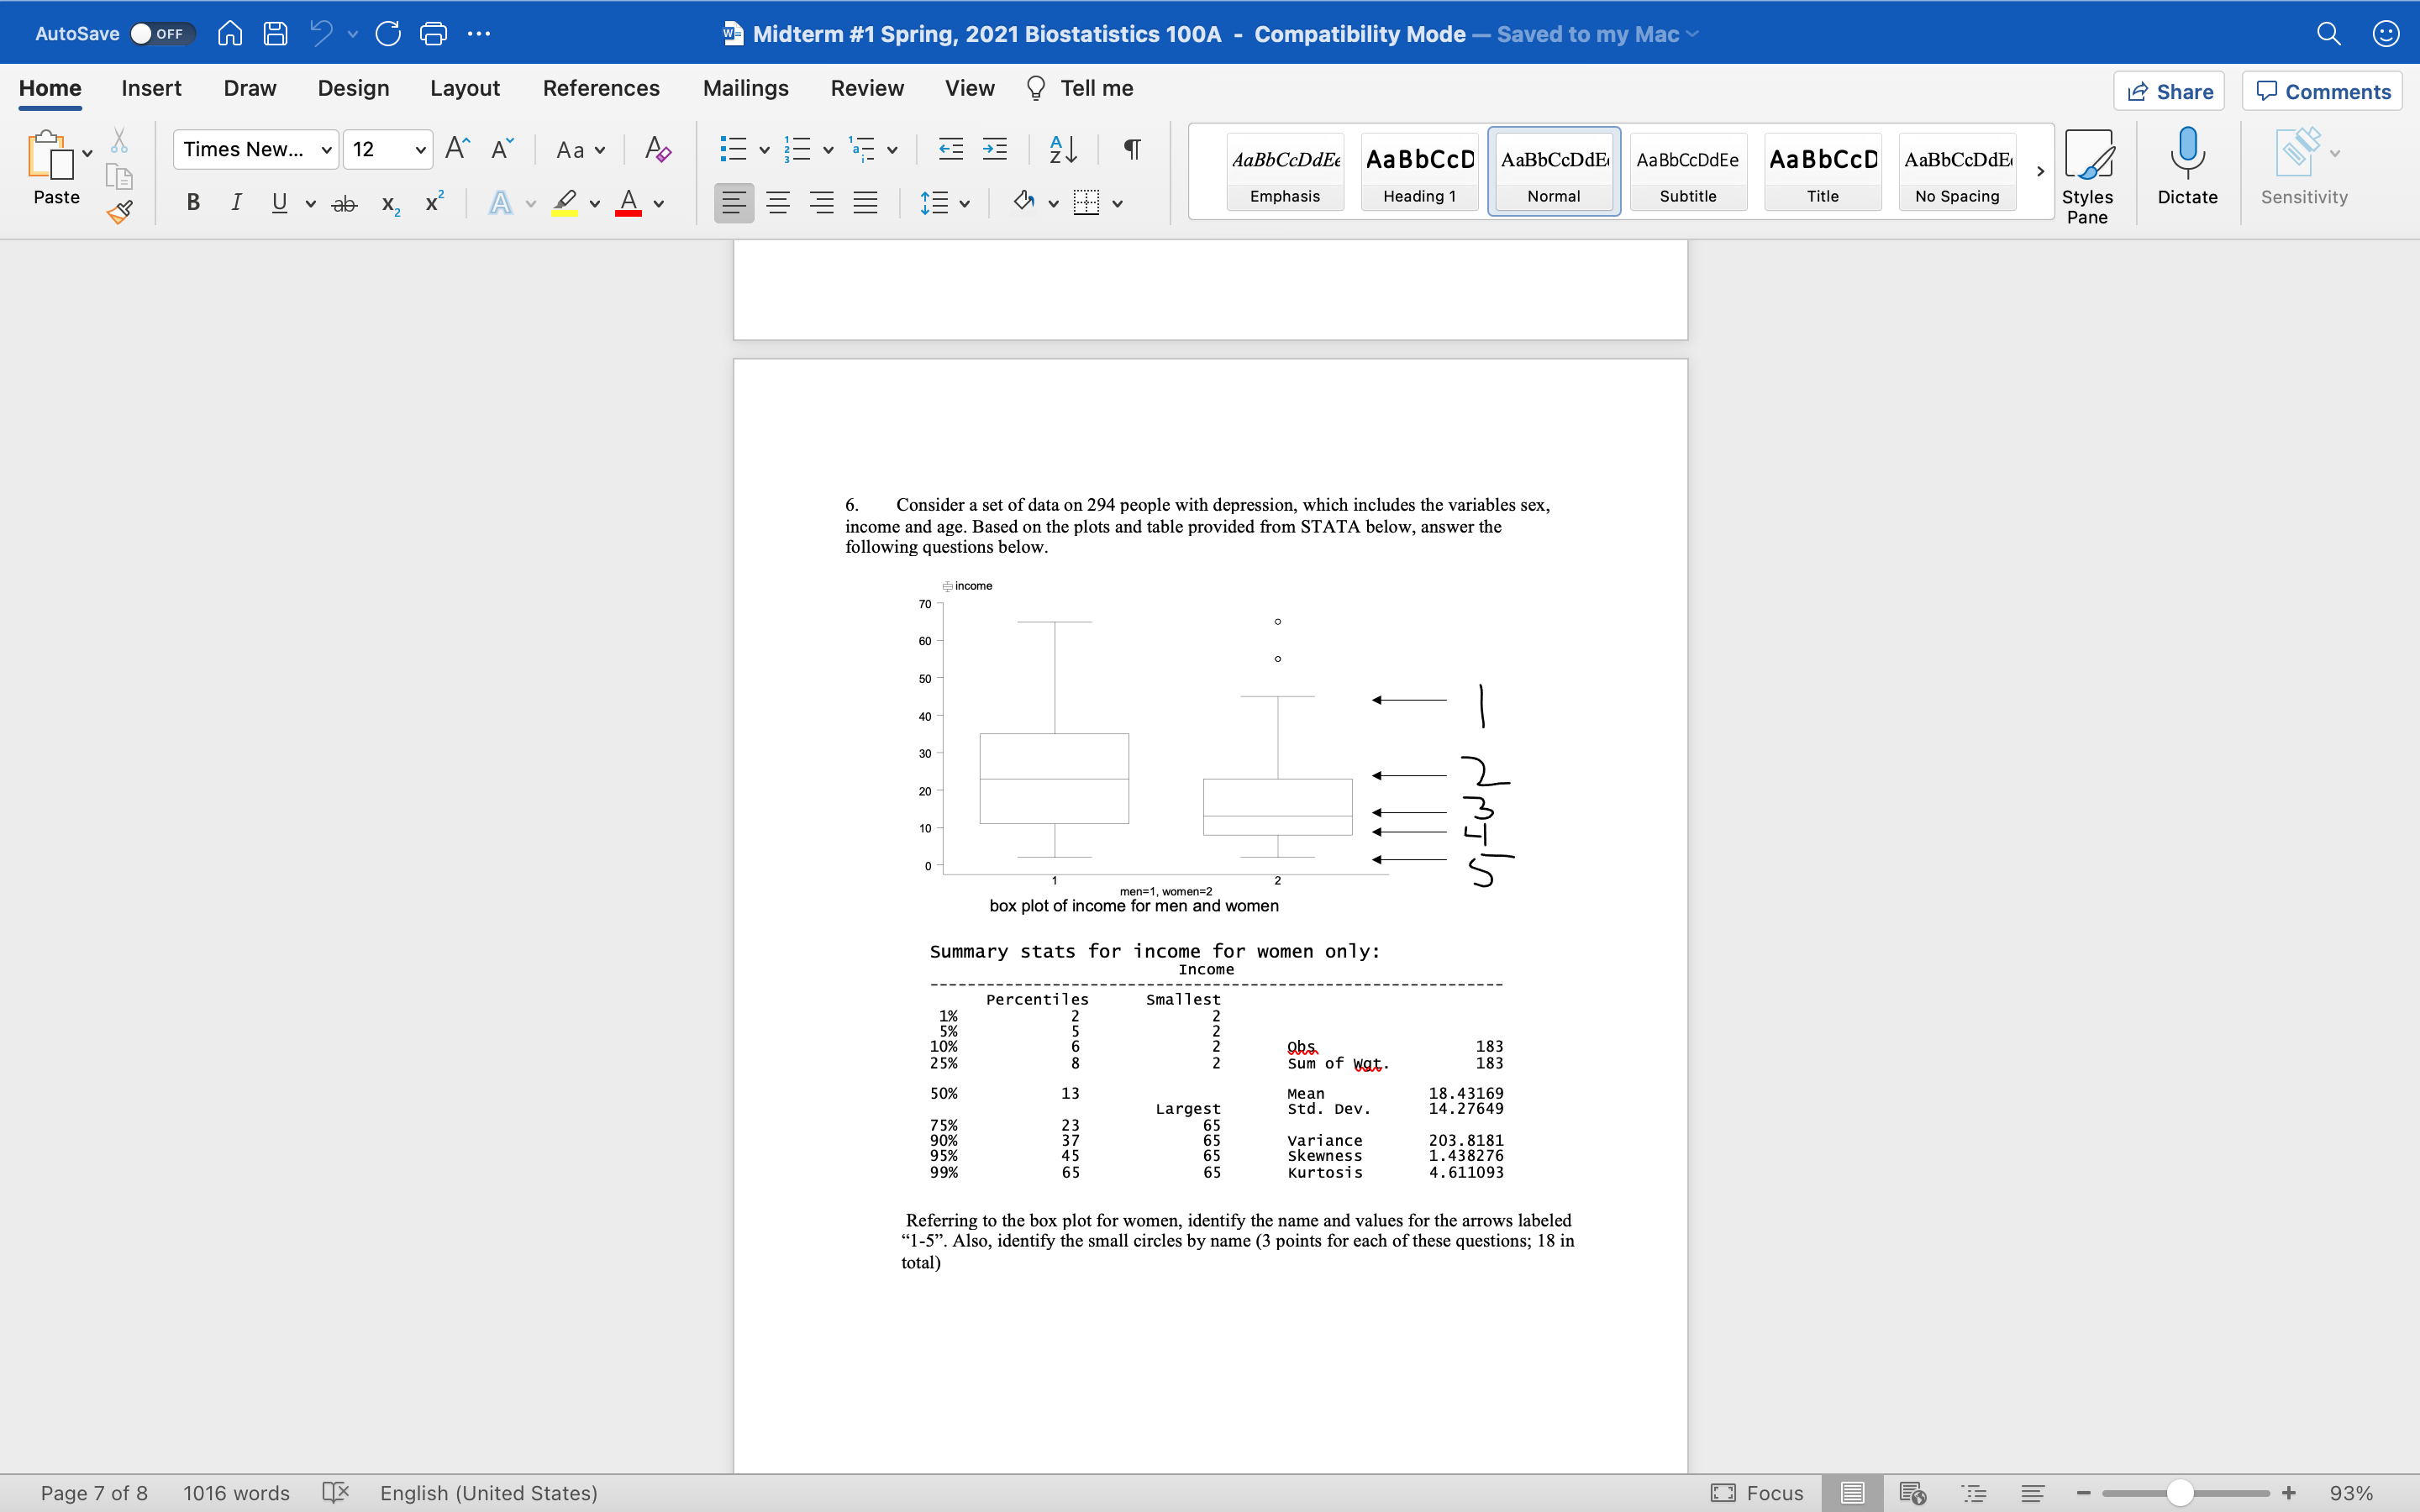
AutoSave OFF 9 06 ... w- Midterm #1 Spring, 2021 Biostatistics 100A - Compatibility Mode - Saved to my Mac Home Insert Draw Design Layout References Mailings Review View ? Tell me Share Comments Times New... v 12 AaBbCcDdEe AaBbCcD AaBbCcDdE AaBbCcDdEe AaBbCcD AaBbCcDdE Paste BIUvab X X |A LA Emphasis Heading 1 Normal Subtitle Title No Spacing Styles Dictate Sensitivity Pane 6 . Consider a set of data on 294 people with depression, which includes the variables sex, income and age. Based on the plots and table provided from STATA below, answer the following questions below. income 70 60 50 40- 30- 20 10 men=1, women = 2 box plot of income for men and women Summary stats for income for women only: Income Percentiles Smallest NNNN 10% 183 25% sum of wat. 183 50% 13 Mean 18 . 43169 Largest Std. Dev. 14.27649 75% 23 65 90% 45 65 variance 203 . 8181 95% Skewness 1. 438276 Kurtosis 4. 611093 Referring to the box plot for women, identify the name and values for the arrows labeled "1-5". Also, identify the small circles by name (3 points for each of these questions; 18 in total) Page 7 of 8 1016 words X English (United States) Focus E + 93%
Step by Step Solution
There are 3 Steps involved in it

Get step-by-step solutions from verified subject matter experts