

Question: Help Please!! begin{tabular}{|c|c|c|c|c|} hline A & B & c & D & E hline & & & & hline & How many Airlines
Help Please!!
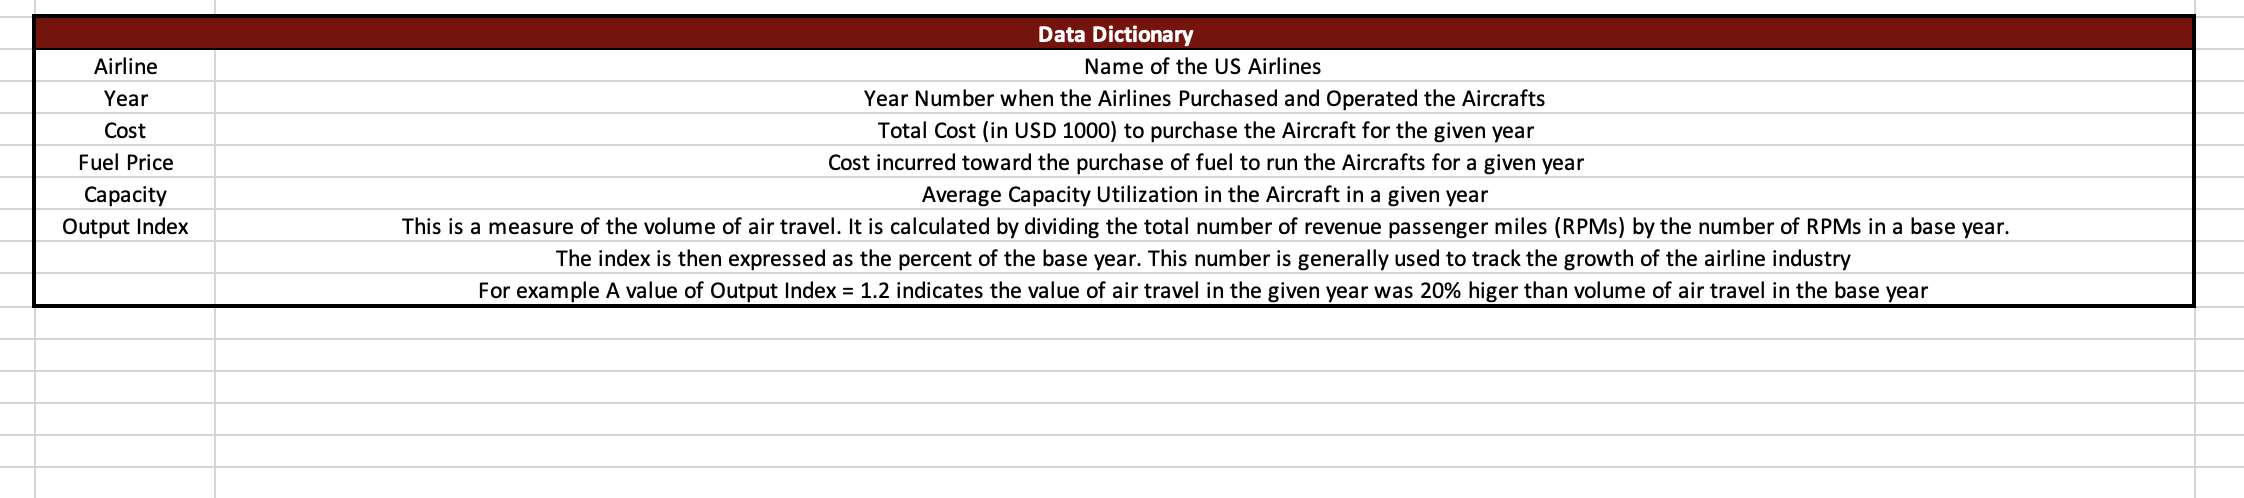
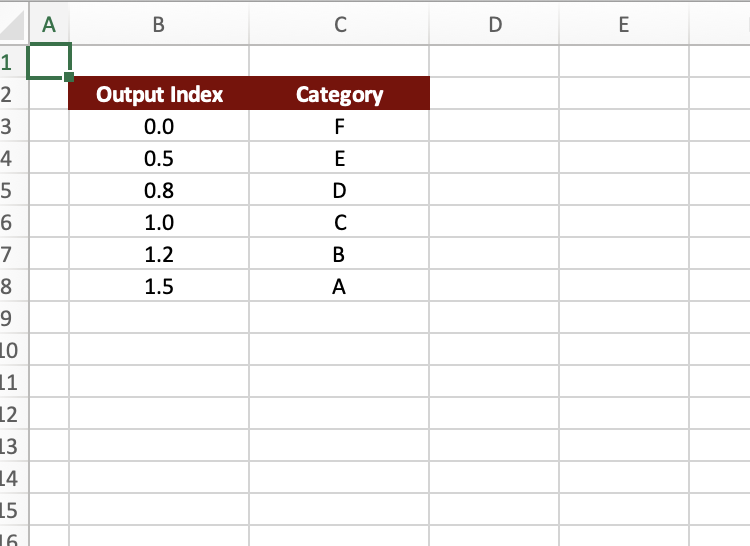
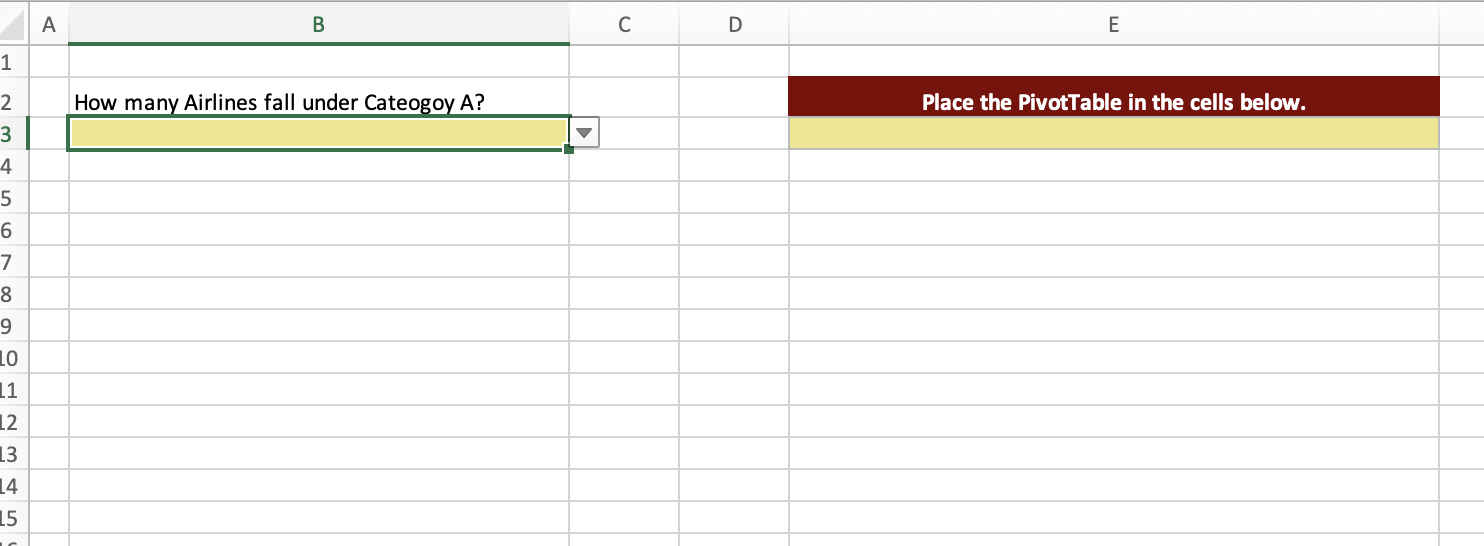
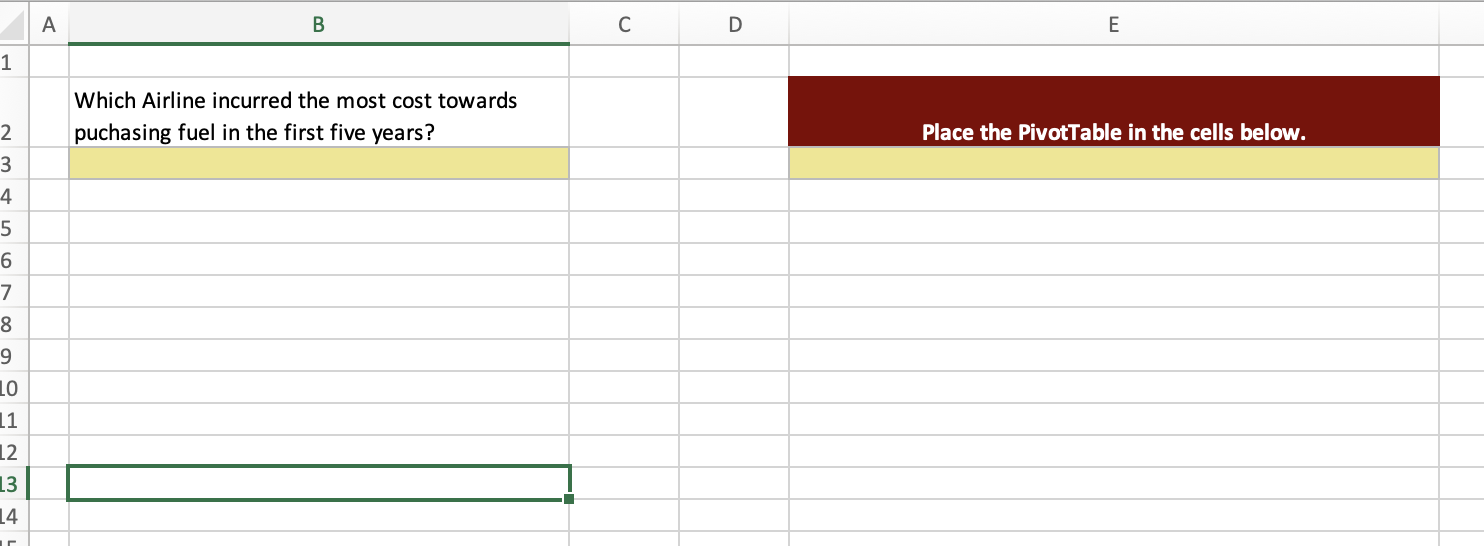
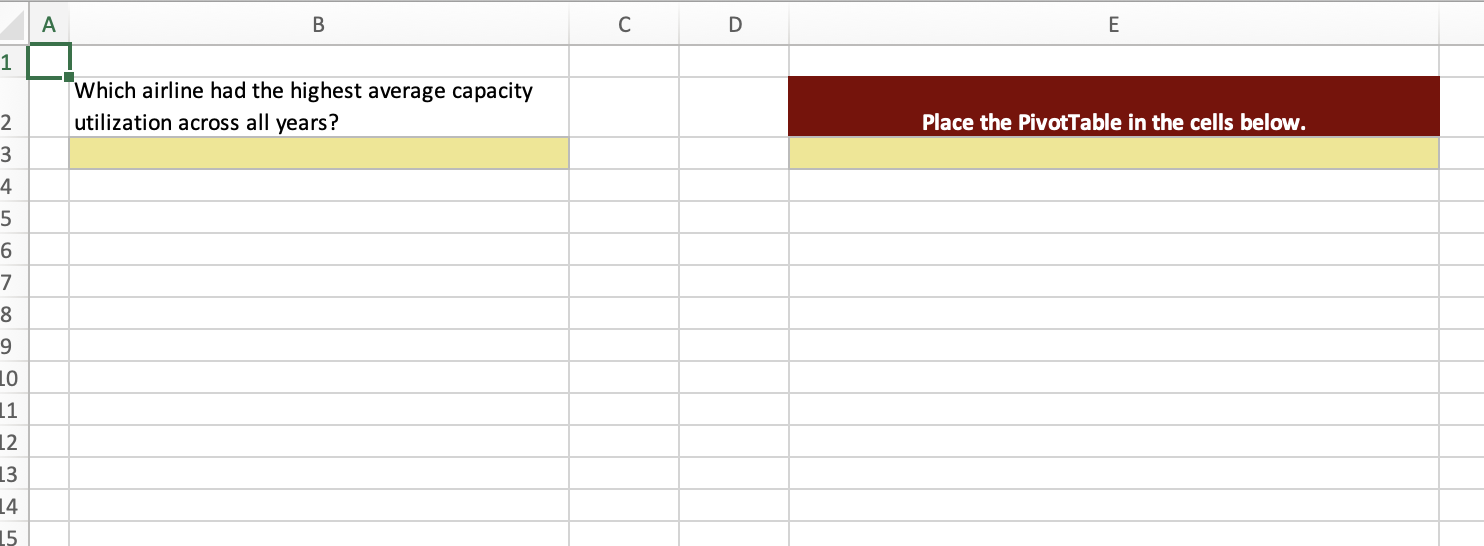
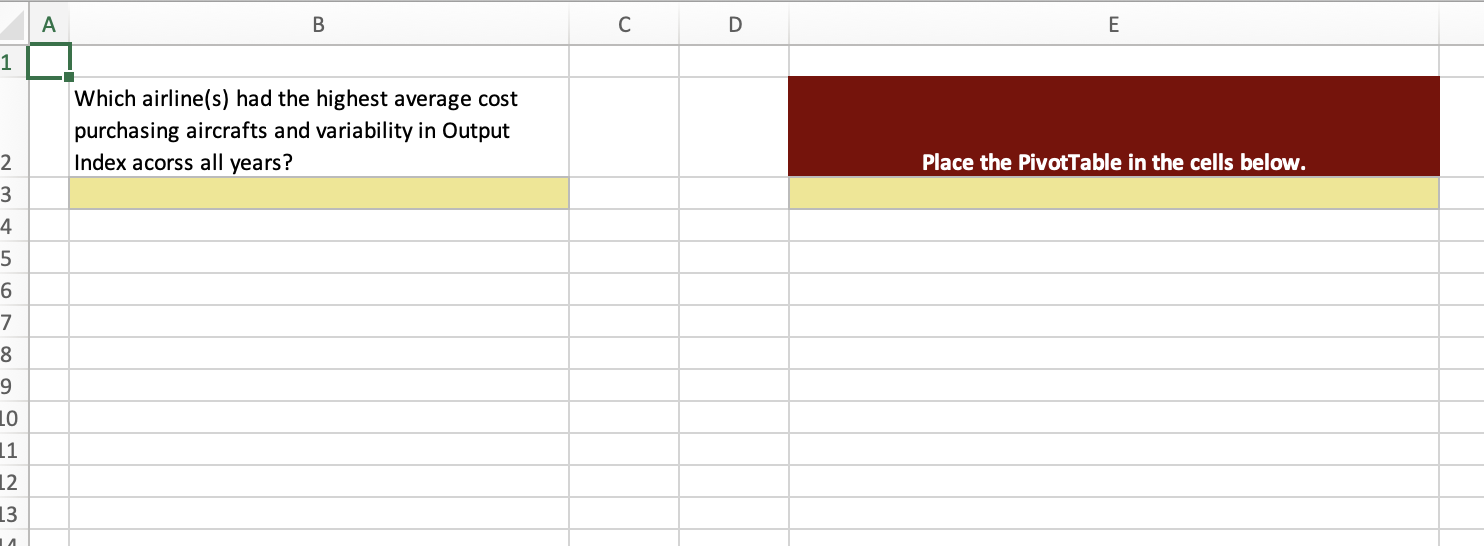
\begin{tabular}{|c|c|c|c|c|} \hline A & B & c & D & E \\ \hline & & & & \\ \hline & How many Airlines fall under Cateogoy A? & & & Place the PivotTable in the cells below. \\ \hline & & & & \\ \hline & & & & \\ \hline & & & & \\ \hline & & & & \\ \hline & & & & \\ \hline & & & & \\ \hline & & & & \\ \hline & & & & \\ \hline & & & & \\ \hline & & & & \\ \hline & & & & \\ \hline \end{tabular} \begin{tabular}{|c|c|c|c|c|} \hline A & B & C & D & E \\ \hline & & & & \\ \hline & Output Index & Category & & \\ \hline & 0.0 & F & & \\ \hline & 0.5 & E & & \\ \hline & 0.8 & D & & \\ \hline & 1.0 & C & & \\ \hline & 1.2 & B & & \\ \hline & 1.5 & A & & \\ \hline & & & & \\ \hline & & & & \\ \hline & & & & \\ \hline & & & & \\ \hline & & & & \\ \hline & & & & \\ \hline & & & & \\ \hline & & & & \\ \hline \end{tabular} \begin{tabular}{|c|c|} \hline A & B \\ \hline \\ \hline & WhichAirlineincurredthemostcosttowardspuchasingfuelinthefirstfiveyears? \\ \hline & \\ \hline & \\ \hline & \\ \hline & \\ \hline & \\ \hline & \\ \hline & \\ \hline & \\ \hline & \\ \hline & \\ \hline & \\ \hline \end{tabular} \begin{tabular}{|c|c|} \hline A & B \\ \hline \\ \hline & WhichAirlineincurredthemostcosttowardspuchasingfuelinthefirstfiveyears? \\ \hline & \\ \hline & \\ \hline & \\ \hline & \\ \hline & \\ \hline & \\ \hline & \\ \hline & \\ \hline & \\ \hline & \\ \hline & \\ \hline \end{tabular} \begin{tabular}{|c|c|} \hline \multicolumn{2}{|r|}{ Data Dictionary } \\ \hline Airline & Name of the US Airlines \\ \hline Year & Year Number when the Airlines Purchased and Operated the Aircrafts \\ \hline Cost & Total Cost (in USD 1000) to purchase the Aircraft for the given year \\ \hline Fuel Price & Cost incurred toward the purchase of fuel to run the Aircrafts for a given year \\ \hline Capacity & \\ \hline \multirow[t]{3}{*}{ Output Index } & AverageCapacityUtilizationintheAircraftinagivenyearThisisameasureofthevolumeofairtravel.Itiscalculatedbydividingthetotalnumberofrevenuepassengermiles(RPMs)bythenumberofRPMsinabaseyear. \\ \hline & The index is then expressed as the percent of the base year. This number is generally used to track the growth of the airline industry \\ \hline & For example A value of Output Index = 1.2 indicates the value of air travel in the given year was 20% higer than volume of air travel in the base year \\ \hline \end{tabular} \begin{tabular}{|c|c|c|c|c|} \hline A & B & c & D & E \\ \hline & & & & \\ \hline & How many Airlines fall under Cateogoy A? & & & Place the PivotTable in the cells below. \\ \hline & & & & \\ \hline & & & & \\ \hline & & & & \\ \hline & & & & \\ \hline & & & & \\ \hline & & & & \\ \hline & & & & \\ \hline & & & & \\ \hline & & & & \\ \hline & & & & \\ \hline & & & & \\ \hline \end{tabular} \begin{tabular}{|c|c|c|c|c|} \hline & B & C & D & E \\ \hline & & & & \\ \hline & Airlines,intotal,wereclassifiedundercategoryAandB? & & & Place the PivotTable in the cells below. \\ \hline & & & & \\ \hline & & & & \\ \hline & & & & \\ \hline & & & & \\ \hline & & & & \\ \hline & & & & \\ \hline & & & & \\ \hline & & & & \\ \hline & & & & \\ \hline & & & & \\ \hline & & & & \\ \hline & & & & \\ \hline \end{tabular}
Step by Step Solution
There are 3 Steps involved in it

Get step-by-step solutions from verified subject matter experts