

Question: Help please Chrome File Edit View History Bookmarks Profiles Tab Window Help MyLab and Mastering X Do Homework - Homework 2.2 x New Tab *
Help please
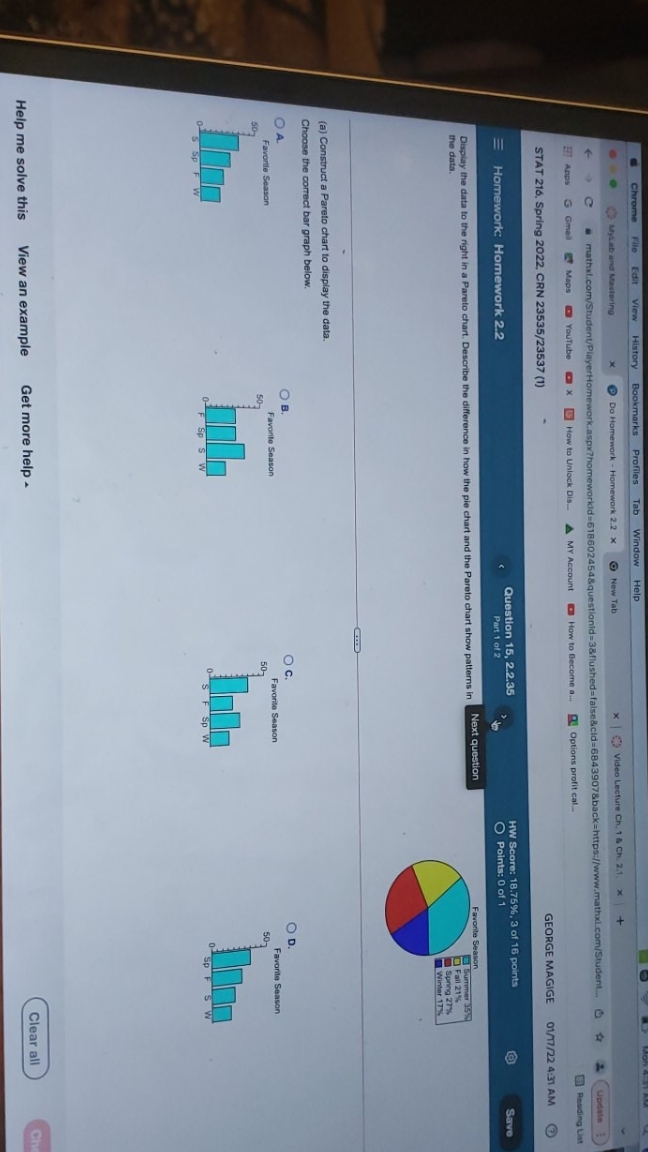
Chrome File Edit View History Bookmarks Profiles Tab Window Help MyLab and Mastering X Do Homework - Homework 2.2 x New Tab * | ( Video Lecture Ch. 1 & Ch. 2.1, * + C mathxl.com/Student/PlayerHomework.aspx?homeworkld=618602454&questionld=3&flushed=false&cid=6843907&back=https://www.mathaxl.com/Student.. Update : Apps G Gmail 7 Maps Youtube x & How to Unlock Dis.. & MY Account How to Become a... Options profit cal.. H Reading List STAT 216, Spring 2022. CRN 23535/23537 (1) GEORGE MAGIGE 01/17/22 4:31 AM Homework: Homework 2.2 Question 15, 2.2.35 HW Score: 18.75%, 3 of 16 points Part 1 of 2 O Points: 0 of 1 Save Display the data to the right in a Pareto chart. Describe the difference in how the pie chart and the Pareto chart show patterns in Next question Favorite Season the data. Summer 35% Fall 21% Spring 27%% Winter 17% (a) Construct a Pareto chart to display the data. Choose the correct bar graph below. OA O B. O C. OD. Favorite Season Favorite Season Favorite Season Favorite Season 507 507 50- 507 5 SP W Sp S W 5 F Sp W Sp F S Help me solve this View an example Get more help . Clear all
Step by Step Solution
There are 3 Steps involved in it

Get step-by-step solutions from verified subject matter experts