

Question: Help please. Complete the following table by computing the unemployment rate for each age group. Age Unemployment Rate Complete the following table by computing the
Help please.
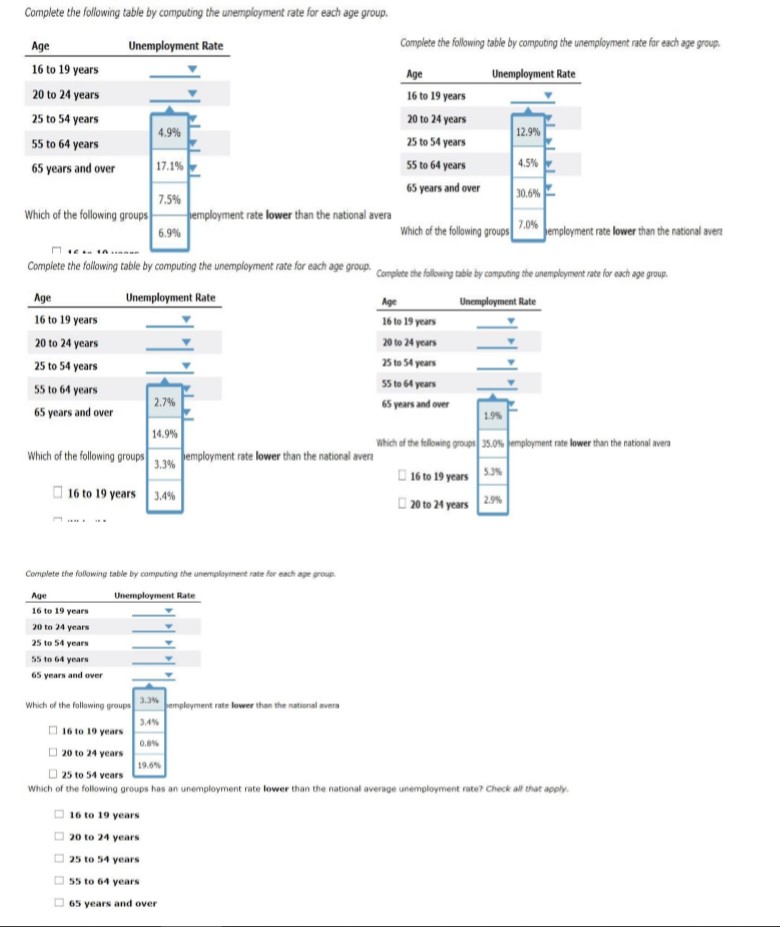
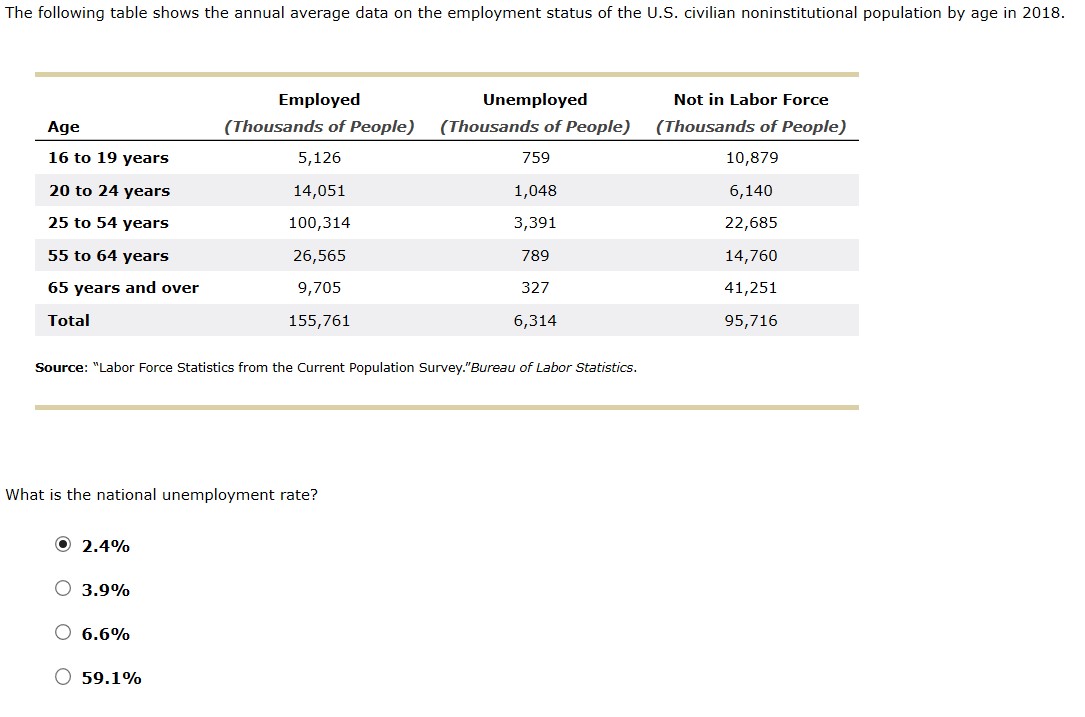
Complete the following table by computing the unemployment rate for each age group. Age Unemployment Rate Complete the following table by computing the unemployment rate for each age group. 16 to 19 years Age Unemployment Rate 20 to 24 years 16 to 19 years 25 to 54 years 20 to 24 years 1.9% 12.9% 55 to 64 years 25 to 54 years 65 years and over 17.1% 55 to 64 years 4.5% 65 years and over 7.5% 30.6% Which of the following groups employment rate lower than the national avera 7.0% 6.9% Which of the following groups employment rate lower than the national avera Complete the following table by computing the unemployment rate for each age group. Complete the following table by computing the unemployment rate for each age group. Age Unemployment Rate Age Unemployment Rate 16 to 19 years 16 to 19 years 20 to 24 years 20 to 24 years 25 to 54 years 25 to 54 years 55 to 64 years 55 to 64 years 2.74% 65 years and over 65 years and over 1.9% 4.9% Which of the following groups 35.0% employment rate lower than the national avera Which of the following groups 3.3% employment rate lower than the national aver 16 to 19 years 5.3% 16 to 19 years 3.4% 20 to 24 years 2.9% Complete the following table by computing the unemployment rate for each age group. Unemployment Rate 16 to 19 years 20 to 24 years 25 to 54 years 55 to 64 years i5 years and over Which of the following groups 3.3% nployment rate lower than the national avera 3.4%% [) 16 to 19 years 20 to 24 years ) 25 to 54 years 19.6% Which of the following groups has an unemployment rate lower than the national average unemployment rate? Check all that apply. 16 to 19 years 20 to 24 years 25 to 54 years 55 to 64 years 65 years and overThe following table shows the annual average data on the employment status of the U.S. civilian noninstitutional population by age in 2018. Employed Unemployed Not in Labor Force Age ( Thousands of People) ( Thousands of People) { Thousands of People) 16 to 19 years 5,126 759 10,3?9 20 to 24 years 14,051 1,048 6,140 25 to 54 years 100,314 3,391 22,685 55 to 64 years 26,565 ?89 14,?60 65 years and over 9,?05 32? 41,251 Total 155,?61 6,314 95,?16 Source: \"Labor Force Statistics from the Current Population Survey."Bureau of Labor Statistics. What is the national unemployment rate? (9 2.4% O 3.9% O 6.6% O 59.1%
Step by Step Solution
There are 3 Steps involved in it

Get step-by-step solutions from verified subject matter experts