

Question: Help Please destion 3 ( 6 points) low the steps to graph the yield curves for rows 02/09/06,02/11/10,02/10/14, and 02/06/18. 1. (1 point) Import the
Help Please
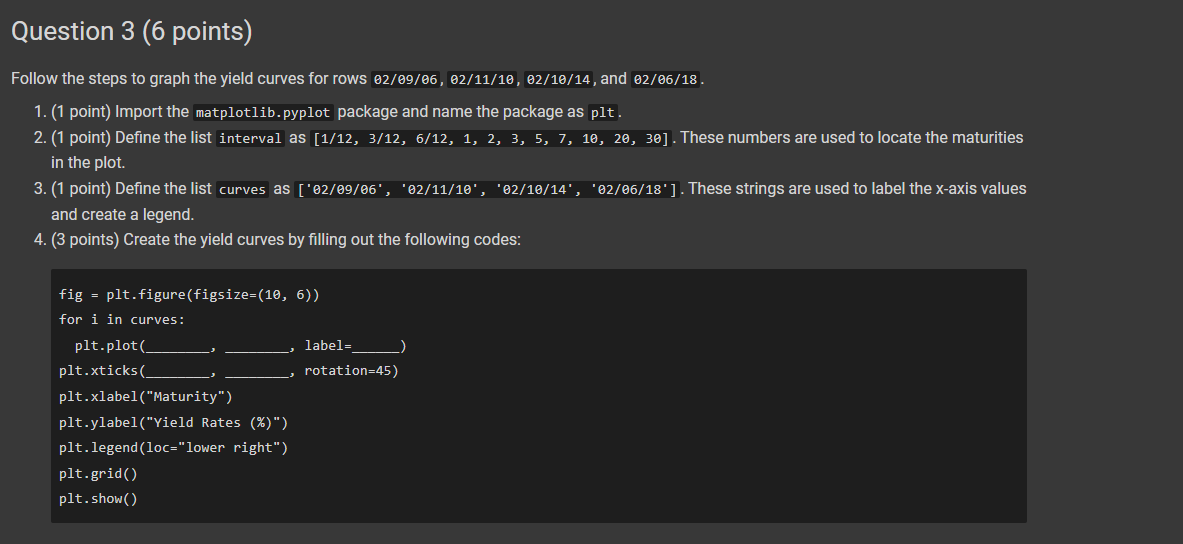
destion 3 ( 6 points) low the steps to graph the yield curves for rows 02/09/06,02/11/10,02/10/14, and 02/06/18. 1. (1 point) Import the matplotlib.pyplot package and name the package as plt. 2. (1 point) Define the list interval as [1/12,3/12,6/12,1,2,3,5,7,10,20,30]. These numbers are used to locate the maturities in the plot. 3. (1 point) Define the list curves as [02/09/06,2/11/10,,02/10/14,,02/06/18]. These strings are used to label the x-axis values and create a legend. 4. (3 points) Create the yield curves by filling out the following codes
Step by Step Solution
There are 3 Steps involved in it
1 Expert Approved Answer
Step: 1 Unlock

Question Has Been Solved by an Expert!
Get step-by-step solutions from verified subject matter experts
Step: 2 Unlock
Step: 3 Unlock