

Question: help please:) Eazy Co. financial data 2018 $172,000 Accounts Payable Beginning Inventory Ending Inventory Cost of Goods Sold 2019 $192,000 118,000 138,000 750,000 2020 $242,000
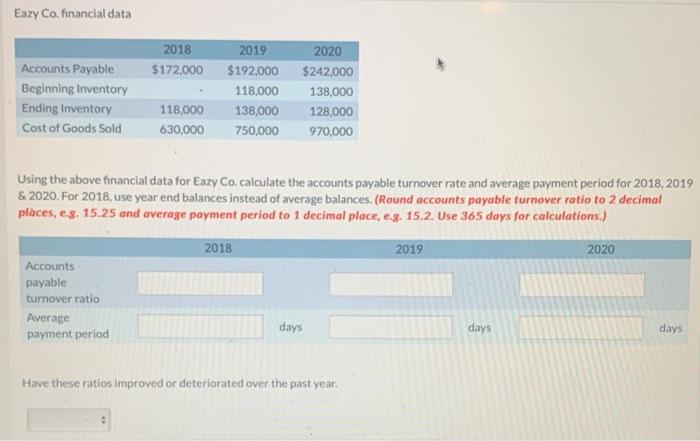
Eazy Co. financial data 2018 $172,000 Accounts Payable Beginning Inventory Ending Inventory Cost of Goods Sold 2019 $192,000 118,000 138,000 750,000 2020 $242,000 138,000 128.000 970,000 118,000 630,000 Using the above financial data for Eazy Co. calculate the accounts payable turnover rate and average payment period for 2018, 2019 & 2020. For 2018, use year end balances instead of average balances. (Round accounts payable turnover ratio to 2 decimal places, c.8. 15.25 and average payment period to 1 decimal place, es. 15.2. Use 365 days for calculations.) 2018 2019 2020 Accounts payable turnover ratio Average payment period days days days Have these ratios improved or deteriorated over the past year
Step by Step Solution
There are 3 Steps involved in it

Get step-by-step solutions from verified subject matter experts