

Question: Help please - Excel Table & question 1-9 . Please provide the formula for the excel table also Home Depot Demand for Lighting Fixtures Use
Help please - Excel Table & question 1-9 . Please provide the formula for the excel table also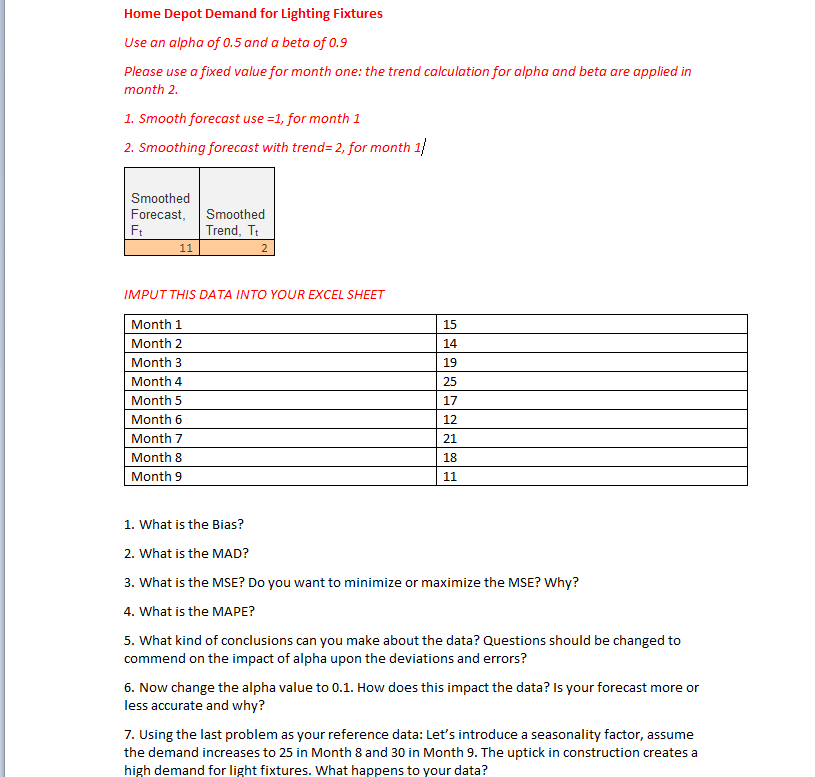
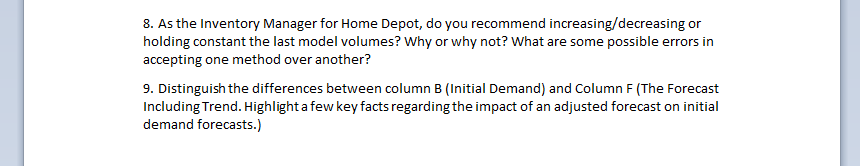
Home Depot Demand for Lighting Fixtures Use an alpha of 0.5 and a beta of 0.9 Please use a fixed value for month one: the trend calculation for alpha and beta are applied in month 2. 1. Smooth forecast use =1, for month 1 2. Smoothing forecast with trend=2, for month 1/ Smoothed Forecast, Smoothed Ft Trend, Tt 11 2 2493 IMPUT THIS DATA INTO YOUR EXCEL SHEET Month 1 Month 2 Month 3 Month 4 Month 5 Month 6 Month 7 Month 8 Month 9 17 12 21 18 11 1. What is the Bias? 2. What is the MAD? 3. What is the MSE? Do you want to minimize or maximize the MSE? Why? 4. What is the MAPE? 5. What kind of conclusions can you make about the data? Questions should be changed to commend on the impact of alpha upon the deviations and errors? 6. Now change the alpha value to 0.1. How does this impact the data? Is your forecast more or less accurate and why? 7. Using the last problem as your reference data: Let's introduce a seasonality factor, assume the demand increases to 25 in Month 8 and 30 in Month 9. The uptick in construction creates a high demand for light fixtures. What happens to your data? 8. As the Inventory Manager for Home Depot, do you recommend increasing/decreasing or holding constant the last model volumes? Why or why not? What are some possible errors in accepting one method over another? 9. Distinguish the differences between column B (Initial Demand) and Column F(The Forecast Including Trend. Highlight a few key facts regarding the impact of an adjusted forecast on initial demand forecasts.) Home Depot Demand for Lighting Fixtures Use an alpha of 0.5 and a beta of 0.9 Please use a fixed value for month one: the trend calculation for alpha and beta are applied in month 2. 1. Smooth forecast use =1, for month 1 2. Smoothing forecast with trend=2, for month 1/ Smoothed Forecast, Smoothed Ft Trend, Tt 11 2 2493 IMPUT THIS DATA INTO YOUR EXCEL SHEET Month 1 Month 2 Month 3 Month 4 Month 5 Month 6 Month 7 Month 8 Month 9 17 12 21 18 11 1. What is the Bias? 2. What is the MAD? 3. What is the MSE? Do you want to minimize or maximize the MSE? Why? 4. What is the MAPE? 5. What kind of conclusions can you make about the data? Questions should be changed to commend on the impact of alpha upon the deviations and errors? 6. Now change the alpha value to 0.1. How does this impact the data? Is your forecast more or less accurate and why? 7. Using the last problem as your reference data: Let's introduce a seasonality factor, assume the demand increases to 25 in Month 8 and 30 in Month 9. The uptick in construction creates a high demand for light fixtures. What happens to your data? 8. As the Inventory Manager for Home Depot, do you recommend increasing/decreasing or holding constant the last model volumes? Why or why not? What are some possible errors in accepting one method over another? 9. Distinguish the differences between column B (Initial Demand) and Column F(The Forecast Including Trend. Highlight a few key facts regarding the impact of an adjusted forecast on initial demand forecasts.)
Step by Step Solution
There are 3 Steps involved in it

Get step-by-step solutions from verified subject matter experts